Related futures

MNQ Short: Rejection at Major Structural ResistancePrice action on the 4-hour chart has retraced into a key structural level. The recent rally appears to be stalling at this horizontal resistance, presenting a high-probability bearish setup. I am looking for a rejection here to resume the broader downward momentum.
Trade Plan:
Direction: Short / S

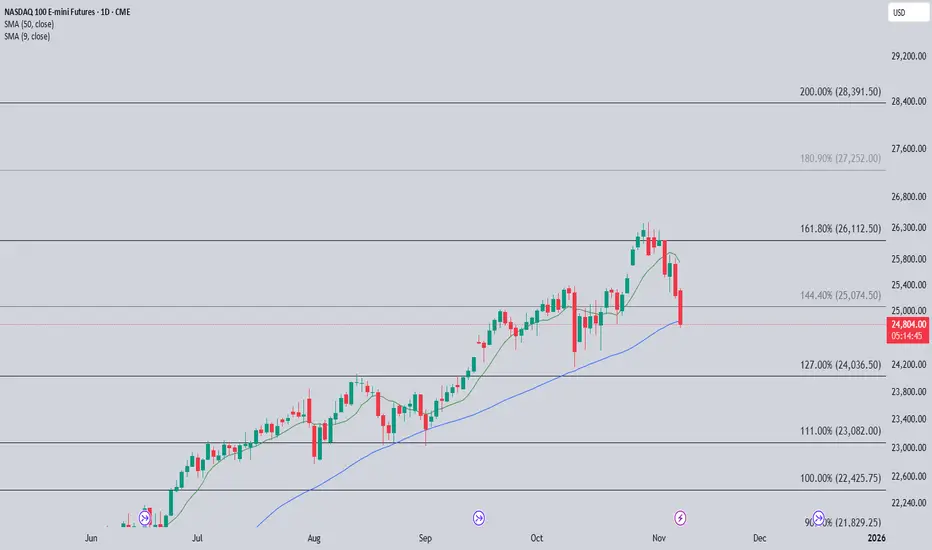
NQ1! 14/11/2025 outlookBias → Bearish
Large sell-off yesterday on both S&P 500 and Nasdaq.
Both filled week opening gaps and are holding below.
Another “b-shaped” daily profile yesterday indicating value is lower
Nasdaq closed inside 7th november's value area
Looking for value retest to 24,810 OR low of 24,708.25

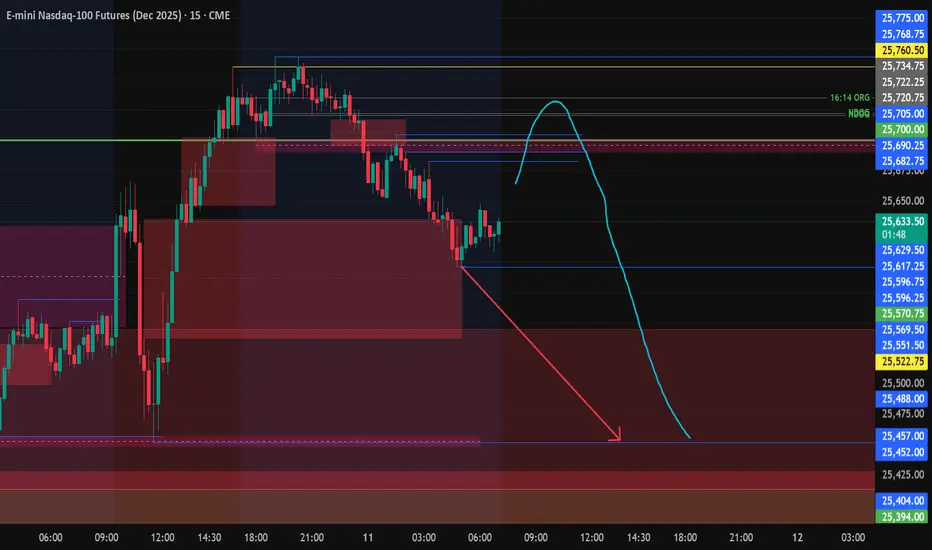
NASDAQ towards 25450emini NQZ heading towards 25450 may be from 25700
yesterdays RTH low liquidity hunting
U.S AI stocks view & U.S Market View #CautiousU.S.A AI stocks view
-Uptrend completed/Uptrend matured
-Short//sell on rise
-Book your long term portfolio profits.
Nasdaq & Dow Jones View
-Uptrend completed
-Sell on Rise
Overall U.S Market scenario seems BEARISH & RISKY for long term.
-VALUATION Issues specifically in AI Stocks.
Nasdaq has com
Nasdaq 100 E-mini Futures is declining According to my analysis on the 4-hour timeframe, there is a high probability of a decline in NASDAQ 100 futures toward $250.500 after a breakout from the triangle highlighted on the chart

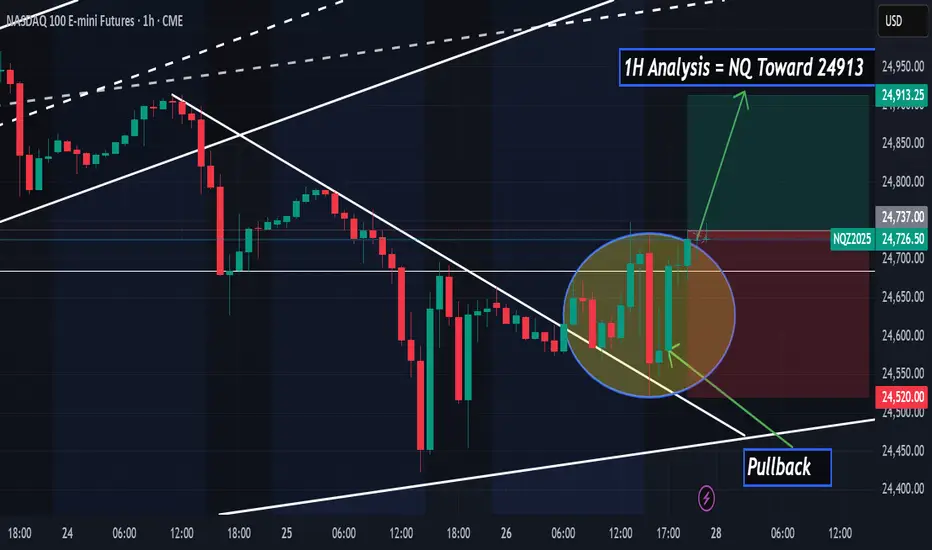
Bullish Opportunity on Nasdaq 100hello,
On the 1-hour chart, the Nasdaq 100 shows a pullback to the trendline, suggesting a high-probability buying opportunity.
Ibrouri Abdessamad
NQ SENTIMENTAL ANALYSIS 29 SEP 25Market Recap & Trade Insight
After the London open, price showed strong one-sided momentum, which was later swept, fueling a sharp bullish move toward all-time highs. From the ATH, a significant retracement unfolded, breaking 5-minute structure and attracting aggressive sellers.
However, when an as

Global Events Impacting Nifty & Sensex1. The Role of Globalization in Stock Markets
Before diving into specific events, it’s important to understand why global developments matter for India’s Nifty and Sensex.
Foreign Institutional Investors (FIIs):
FIIs are among the biggest drivers of India’s stock markets. Their decisions are often
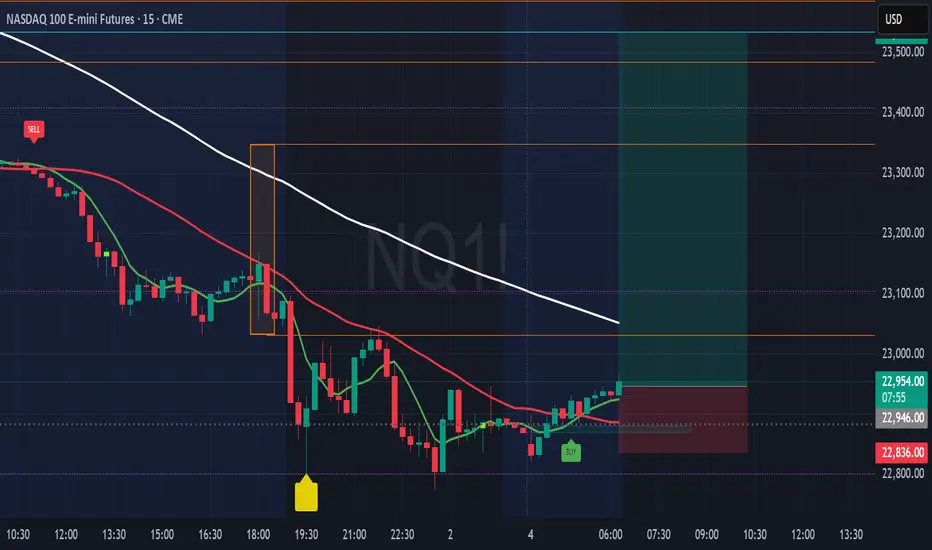
NQ100 - Eyes Long Towards 23531📌 NQ100 Futures 15-min — Buy Signal After Momentum Exhaustion & Trap Zone
Technical Structure Insights (15m):
🟡 A caution label printed near the evening session, highlighting a potential trap zone after short-term buyers were absorbed near the white moving average (trend resistance).
🔻 Price broke
See all ideas
Summarizing what the indicators are suggesting.
Neutral
SellBuy
Strong sellStrong buy
Strong sellSellNeutralBuyStrong buy
Neutral
SellBuy
Strong sellStrong buy
Strong sellSellNeutralBuyStrong buy
Neutral
SellBuy
Strong sellStrong buy
Strong sellSellNeutralBuyStrong buy
A representation of what an asset is worth today and what the market thinks it will be worth in the future.
Frequently Asked Questions
The current price of Micro E-mini Nasdaq-100 Index Futures (Jun 2026) is 26,177.25 USD — it has risen 0.33% in the past 24 hours. Watch Micro E-mini Nasdaq-100 Index Futures (Jun 2026) price in more detail on the chart.
The volume of Micro E-mini Nasdaq-100 Index Futures (Jun 2026) is 52.00. Track more important stats on the Micro E-mini Nasdaq-100 Index Futures (Jun 2026) chart.
The nearest expiration date for Micro E-mini Nasdaq-100 Index Futures (Jun 2026) is Jun 18, 2026.
Traders prefer to sell futures contracts when they've already made money on the investment, but still have plenty of time left before the expiration date. Thus, many consider it a good option to sell Micro E-mini Nasdaq-100 Index Futures (Jun 2026) before Jun 18, 2026.
Open interest is the number of contracts held by traders in active positions — they're not closed or expired. For Micro E-mini Nasdaq-100 Index Futures (Jun 2026) this number is 383.00. You can use it to track a prevailing market trend and adjust your own strategy: declining open interest for Micro E-mini Nasdaq-100 Index Futures (Jun 2026) shows that traders are closing their positions, which means a weakening trend.
Buying or selling futures contracts depends on many factors: season, underlying commodity, your own trading strategy. So mostly it's up to you, but if you look for some certain calculations to take into account, you can study technical analysis for Micro E-mini Nasdaq-100 Index Futures (Jun 2026). Today its technical rating is buy, but remember that market conditions change all the time, so it's always crucial to do your own research. See more of Micro E-mini Nasdaq-100 Index Futures (Jun 2026) technicals for a more comprehensive analysis.