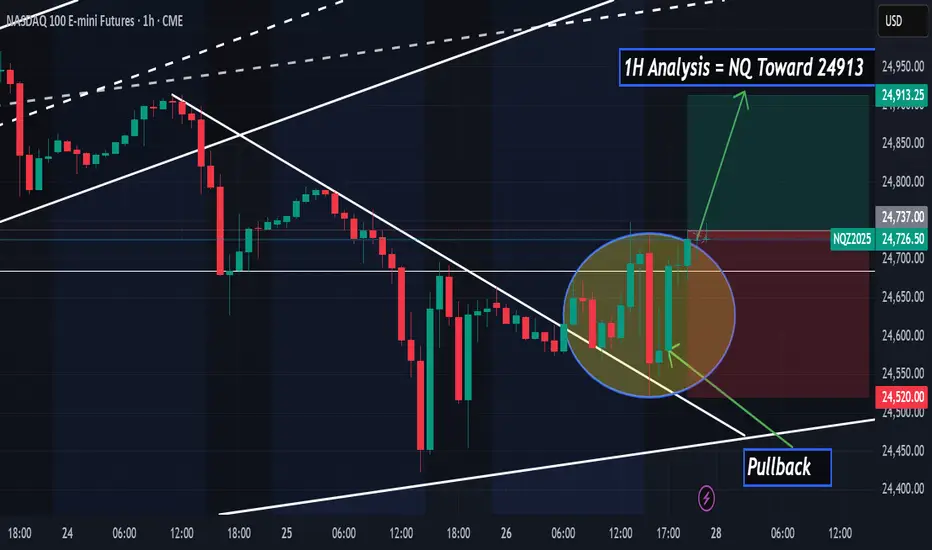
Bullish Opportunity on Nasdaq 100hello,
On the 1-hour chart, the Nasdaq 100 shows a pullback to the trendline, suggesting a high-probability buying opportunity.
Ibrouri Abdessamad
About NASDAQ 100 E-mini Futures
An index composed of the 100 largest, most actively traded US companies listed on the Nasdaq stock exchange. This index includes companies from a broad range of industries with the exception of those that operate in the financial industry, such as banks and investment companies.
Related futures
NQ SENTIMENTAL ANALYSIS 29 SEP 25Market Recap & Trade Insight
After the London open, price showed strong one-sided momentum, which was later swept, fueling a sharp bullish move toward all-time highs. From the ATH, a significant retracement unfolded, breaking 5-minute structure and attracting aggressive sellers.
However, when an as

Global Events Impacting Nifty & Sensex1. The Role of Globalization in Stock Markets
Before diving into specific events, it’s important to understand why global developments matter for India’s Nifty and Sensex.
Foreign Institutional Investors (FIIs):
FIIs are among the biggest drivers of India’s stock markets. Their decisions are often
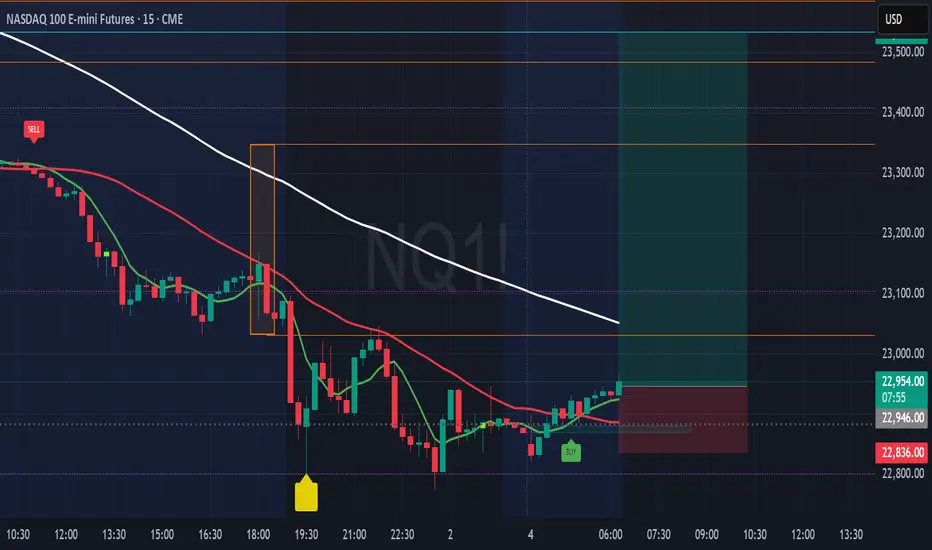
NQ100 - Eyes Long Towards 23531📌 NQ100 Futures 15-min — Buy Signal After Momentum Exhaustion & Trap Zone
Technical Structure Insights (15m):
🟡 A caution label printed near the evening session, highlighting a potential trap zone after short-term buyers were absorbed near the white moving average (trend resistance).
🔻 Price broke
NAS100 breaks ATH Here the 15 min charts having all information all context that how money travels so long.
there is a smooth SMT divergence with S&P500.That added the story telling more strong.
Today is FOMC meeting lets see the market direction.

Weekly Review for US Indices. Bearish.Hello traders!
I've mentioned everything on the chart itself. Attaching YM and ES charts as well.
YM
ES
Note that if YM breaks Thurday's high, analysis of NQ and ES will be negated as well.
GLGT!
NASDAQ 100 E-Mini Future Weekly Technical Analysis 31Mar-4Apr!🚀 Unlock the potential with my NASDAQ 100 E-Mini Future Weekly Technical Analysis for 31st March to 4th April 2025!
✨ Boost, follow, and engage for updates. Your support means a lot! 🚀❤️
📍 Range Trigger Point (WRTP): 19,457
📅 Weekly Range: 1,179
📈 Long Position
🔹 Buy Above: 20,086
🎯 Target 1: 20,

Buy Nasdaq nesr 20300 , upside Target 21400, SL recent lowHow to take trades using Harmonic pattern projection Trade setup is explained below :-
Entry : 1st SL point : 0% is recent top or bottom.
Trailing D: 11.4% is work as trailing SL of buy or sell trade if hit then we have to book profit
.If price goes below 2nd D 21.4% to 23.6% range then early

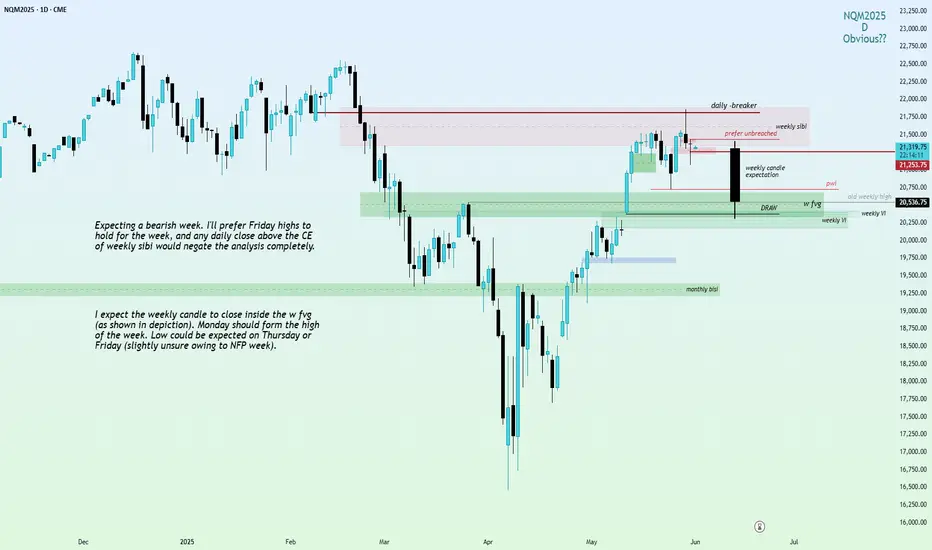
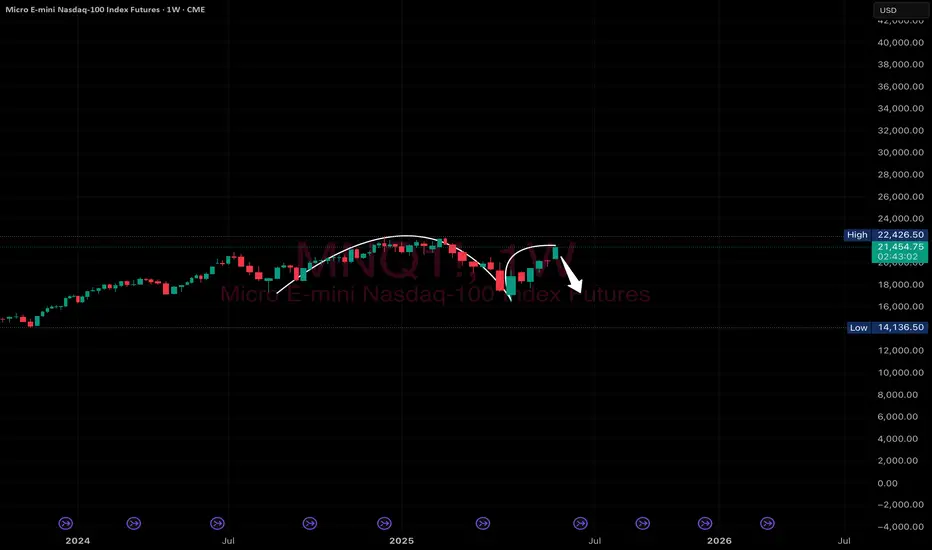
Welcome to bearishnessNQ shown the weakness in monthly TF. In Upcoming weeks we would see good downfall moves

See all ideas
Summarizing what the indicators are suggesting.
Neutral
SellBuy
Strong sellStrong buy
Strong sellSellNeutralBuyStrong buy
Neutral
SellBuy
Strong sellStrong buy
Strong sellSellNeutralBuyStrong buy
Neutral
SellBuy
Strong sellStrong buy
Strong sellSellNeutralBuyStrong buy
A representation of what an asset is worth today and what the market thinks it will be worth in the future.
Displays a symbol's price movements over previous years to identify recurring trends.
Frequently Asked Questions
The current price of NASDAQ 100 E-mini Futures is 25,509.25 USD — it has risen 1.01% in the past 24 hours. Watch NASDAQ 100 E-mini Futures price in more detail on the chart.
The volume of NASDAQ 100 E-mini Futures is 460.04 K. Track more important stats on the NASDAQ 100 E-mini Futures chart.
Open interest is the number of contracts held by traders in active positions — they're not closed or expired. For NASDAQ 100 E-mini Futures this number is 284.80 K. You can use it to track a prevailing market trend and adjust your own strategy: declining open interest for NASDAQ 100 E-mini Futures shows that traders are closing their positions, which means a weakening trend.
Buying or selling futures contracts depends on many factors: season, underlying commodity, your own trading strategy. So mostly it's up to you, but if you look for some certain calculations to take into account, you can study technical analysis for NASDAQ 100 E-mini Futures. Today its technical rating is strong buy, but remember that market conditions change all the time, so it's always crucial to do your own research. See more of NASDAQ 100 E-mini Futures technicals for a more comprehensive analysis.