Copper levels for 19-4-2022Note: Always try to find a good price action patterns or any candle stick patterns in marked zones in smaller timeframe to take entry with small stop loss. If you follow diagonal trendlines you can take entry and exit easily. (Color code (only for diagonal trendlines ): green - bullish , red - bearish , black & violet reversal points). If any doubt for take entry in price action patterns, please ask in comment box, i will try to help.
Disclaimer: Im not tip provider and this chart is not indented to take trade in my levels, It is shared here for learning purpose. It is all your own risk.
Trade ideas

Copper levels for 12-4-2022Slightly modified yesterday levels in copper for today.
Note: Always try to find a good price action patterns or any candle stick patterns in marked zones in smaller timeframe to take entry with small stop loss. If any doubt for take entry in price action patterns, please ask in comment box, i will try to help.
Disclaimer: Im not tip provider and this chart is not indented to take trade in my levels. It is all your own risk.

Copper level for 11-4-2022Copper also not changed my previous view posted on 6-4-2022
Note: Always try to find a good price action patterns or any candle stick patterns in marked zones in smaller timeframe to take entry with small stop loss. If any doubt for take entry in price action patterns, please ask in comment box, i will try to help.
Disclaimer: Im not tip provider and this chart is not indented to take trade in my levels. It is all your own risk.

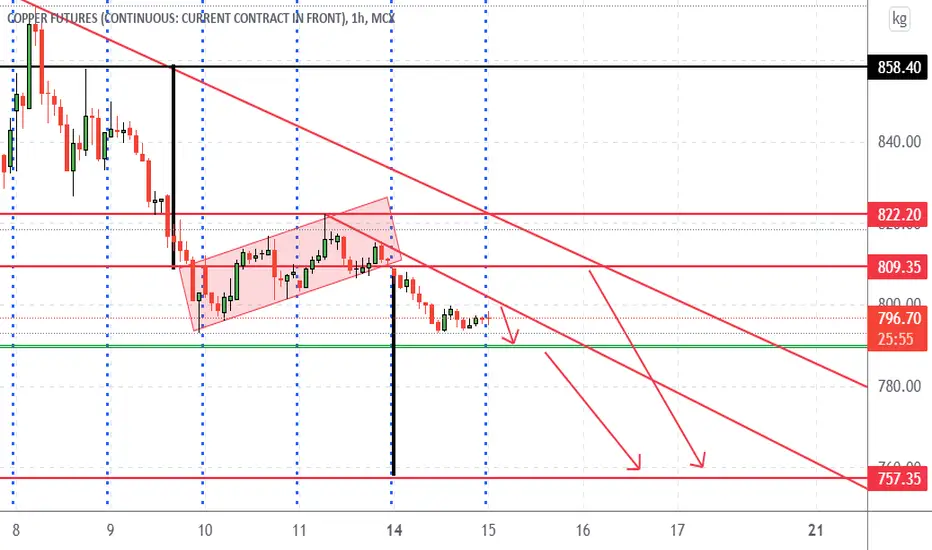
Copper M - Bearish FormationIf breaks and sustains 810 then it may start the downwards journey first till 795/97 below that upto 780 levels

[MCX] Copper Retracement BetNote -
One of the best forms of Price Action is to not try to predict at all. Instead of that, ACT on the price. So, this chart tells at "where" to act in "what direction. Unless it triggers, like, let's say the candle doesn't break the level which says "Buy if it breaks", You should not buy at all.
=======
I use shorthands for my trades.
"Positional" - means You can carry these positions and I do not see sharp volatility ahead. (I tally upcoming events and many small kinds of stuff to my own tiny capacity.)
"Intraday" -means You must close this position at any cost by the end of the day.
"Theta" , "Bounce" , "3BB" or "Entropy" - My own systems.
=======
I won't personally follow any rules. If I "think" (It is never gut feel. It is always some reason.) the trade is wrong, I may take reverse trade. I may carry forward an intraday position. What is meant here - You shouldn't follow me because I may miss updating. You should follow the system I share.
=======
Like -
Always follow a stop loss.
In the case of Intraday trades, it is mostly the "Day's High".
In the case of Positional trades, it is mostly the previous swings.
I do not use Stop Loss most of the time. But I manage my risk with options as I do most of the trades using derivatives.
=======

Copper levels for 6-4-2022Copper market is slightly sideways uptrend, try to find good price action patterns at bottom for buy. If any doubt for take entry in price action patterns, please ask in comment box, i will try to help.
Note: Always try to find a good price action patterns or any candle stick patterns in marked zones in smaller timeframe to take entry with small stop loss.
Disclaimer: Im not tip provider and this chart is not indented to take trade in my levels. It is all your own risk.

MCX copper crucial trendline level to watch 815--813#MCX #copper till now respected the trend line and given and given move from 790 to 830
now this rising trend line levels comes around 815--813.. if copper breaks down this trend line and levels
than it will move down towards 800----790
till it is respecting trend line no shorting... stay with patience
views are educational

MCX copper in triangle and multitime support 790MCX copper i a triangle and range contraction happening...
790 is important multitime support... whereas immediate hurdle is 800--803
breaing out of the triangle will give move towards 820+++
whereas breaking down of 790 will take to another important support 780
views are educational

Copper levels for 25-3-2022Uptrend channel broken and waiting for retest for fresh sell trend.
Note: Always try to find a good price action patterns or any candle stick patterns in marked zones in smaller timeframe to take entry with small stop loss.
Disclaimer: Im not tip provider and this chart is not indented to take trade in my levels. It is all your own risk.

Copper level for 22-3-2022Buy on dip till trend line break is good today.
Disclaimer: Im not tip provider and this chart is not indented to take trade in my levels. It is all your own risk.

MCX copper triangle pattern breakoutMCX copper took the multi time support 790 than given breakout from the triagle and till now made high near 820...
now MCX copper is buy on dip mode
now immediate support near 805--800
sustaining above 820 will give move towards 840++
views are for educational.. play support and resistance

Copper level for 17-3-2022I want to take only after any breakout
Disclaimer: Im not tip provider and this chart is not indented to take trade in my levels. It is all your own risk.

Copper at Support!!Copper at Important support after breaking out of a long consolidation, Also at 20DMA support.
Can head for new ATH if holds current support

Copper view for 15-3-2022Bearish flag pattern, marked here very limited target level only to increase success rate.
Disclaimer: Im not tip provider and this chart is not indented to take trade in my levels. It is all your own risk.
MCX copper range contraction within the triangleMCX copper within the triangle and now range is slowly contracting between 790---826
keep eye on breaking of triangle on either side will give clear trend ahead... till than play support and resistance.. 790 & 826
790 is important support level to watch ... as breaking below this level will bring weakness towards 760--750
whereas breaking out of the triangle will give move towards 850---870
views are educational
plan your trades accordingly..
As a trader one should alaways try to take quality trades ... which will bring patience in to you..
profit or loss is the byproduct of your skill..

MCX copper within the downward channelMCX copper withing the channel and brokem imp support 845-840 with strong bearish candle
below this 820--800 possible on downside...
view is valid till it is below 845
views are for educational


Copper - Verge of a breakoutWith most commodities melting up, copper could be the next one to lift off..
This would affect a lot of wire makers in India so be cautious of this space.
For those trading the commodity it could make for a good long above 4.825 with a SL below 4.70.

COPPER1! - Entry 25-02-2022 14:20:00Symmetrical Continuation Triangle (Bearish)
Implication
A Symmetrical Continuation Triangle (Bearish) is considered a bearish signal, indicating that the current downtrend may continue.
Description
A Symmetrical Continuation Triangle (Bearish) shows two converging trendlines, the lower one is ascending, the upper one is descending. The formation occurs because prices are reaching both lower highs and higher lows. The pattern will display two highs touching the upper (descending) trendline and two lows touching the lower (ascending) trendline.

COPPER1! - Entry 24-02-2022Descending Continuation Triangle
Implication
A Descending Continuation Triangle is considered a bearish signal, indicating that the current downtrend may continue.
Description
A Descending Continuation Triangle features two converging trendlines. The bottom trendline is horizontal and the top trendline slopes downward. The pattern illustrates lows occurring at a constant price level, with highs moving constantly lower. The pattern displays two highs touching the upper trendline and two lows touching the lower trendline.

Copper looking bullish!!!Copper broke resistance 785 level based on the Fibonacci study and heading towards its following levels 815.
Copper will treat 785 as its support level.
GANN resistance levels in between will be 799 & 813.
Strong buy signals appear using Heiken Ashi, Super Trend and Follow Line Indicators in Copper.

#HG # COPPER set to rally 15-20% up out of a triangleCopper has been correcting sideways since the May '21 high. The correction has taken the form of a triangle and the internal waves of the triangle show the expected 3 wave alternating movements. The recent low of 4.25 has a good chance of being the terminal wave e of the triangle. There is also a possibility that we are still in wave d and wave e is yet to form ( see alternate dotted path). If this is the case then wave e will be delayed but will still be expected to be above wave c low of 4.13.
Either way, the triangle has just been completed or will do so soon.
A close above the upper trendline should validate the strength and result in Copper moving 15-20% up. Targets are between 5.25 to 5.45

DR. Copper - Game of PatienceKeep an eye on Copper. It CAN be a wait of few more weeks, before it breaks out
