🚀ENJUSDT Inverse Head & Shoulders: Major Reversal on the Way?💎 Paradisers, #ENJUSDT has formed an inverse head and shoulders pattern, enhancing the probability of a reversal from here.
💎 Currently, if #ENJ closes a candle above the resistance zone, it will validate the pattern, and we can expect a move up to the next resistance levels. Additionally, there's

ENJ "Frenzy Time: Seize the Opportunity for Wealth!"Enjin Coin (ENJ): Short Fundamentals, Recent News, and Disclaimer
Fundamentals:
Enjin (ENJ): A cryptocurrency used on the Enjin platform for creating and managing virtual goods within video games and other blockchain applications.
Launched: June 2018.
Market Cap: ~$2.4 billion (as of Feb 23, 2024).

ENJToo familiar with this type of chart, currently the ENJ cycle is correcting corresponding to wave 2 cycle and preparing to enter wave 3 cycle in this area. Buy and sell according to the arrows

ENJ: Great to pump Entry now to get the wave of ENJ
ENJ's extremely good wave area is creating a highlight for the market to increase strongly. The price is at the buy point area within the ichimoku or current cloud

Bearish Breakout Confirm:- ENJUSDT ??Trade setup:
Bearish breakout from Sideways Channel ($0.50 - $0.75) confirms Downtrend. Price could revisit $0.40
support, which was the prior low from June. set a price alert).
Trend:
Downtrend across all time horizons (Short- Medium- and Long-Term)
Momentum :
is Mixed as MACD Line is above M

ENJUSDT Falling wedge pattern Before Breakoutfalling wedge pattern detected in 4-Hour TF
In 4-hour time frame we can see perfect falling wedge pattern that may break any time. There is high chance of breaking the channel in upper direction but still not confirmed, so it's a good idea to wait for breakout and confirmation .
Condition: If 4-

💡Don't miss the great buy opportunity in ENJUSDT @enjinTrading suggestion:
". There is a possibility of temporary retracement to the suggested support line (1.530).
. if so, traders can set orders based on Price Action and expect to reach short-term targets."
Technical analysis:
. ENJUSDT is in a range bound, and the beginning of an uptrend is expec


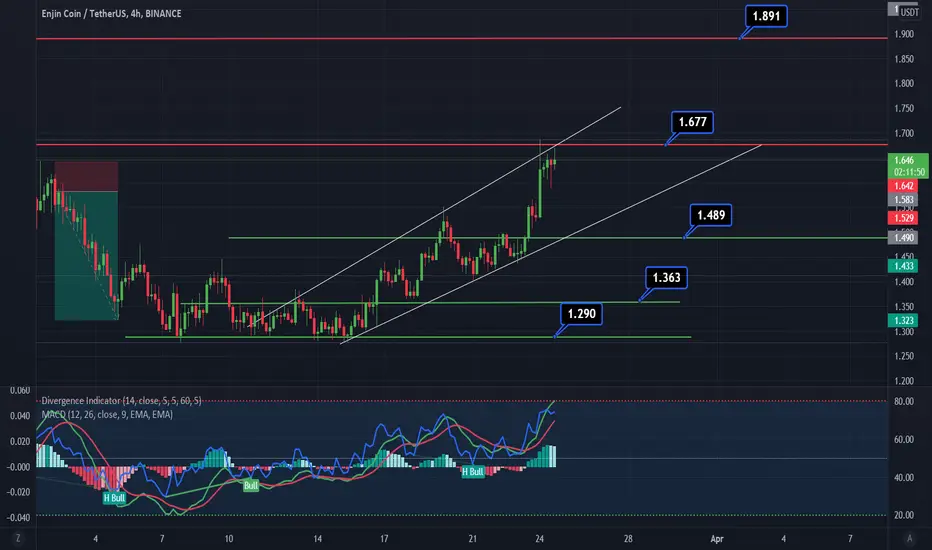
#ENJ scalp zone 4 hr TF with sup. & resis ENJ breaks the resistance and now trading above it. The support for ENJ is $1.489 area. ENJ is bullish above it and the next resistance is $1.677 - $1.891 area. You can add some ENJ near the $1.65 area with a stop loss below $1.50 area.
ENJUSDT can breakout ?ENJUSDT has been resisting a trendline for the last few months. Seems it's gonna break in a couple of days, if not today.
DYOR

See all ideas
Displays a symbol's price movements over previous years to identify recurring trends.