ETHUSD: Reversal Expected Near 4100The bullish outlook remains unchanged. We are expecting the price to reverse near 4100 . The sharp move on wave a, a small correction for wave b, indicates a sharp decline and rapid rise in the upcoming days.
Previous research:
Stay Tuned!
@money_dictators
Thanks :)
Trade ideas

Choose Mutual Funds Smartly1. Understanding Mutual Funds
Before choosing mutual funds, it’s important to understand what they are.
Definition: A mutual fund is a pooled investment vehicle where money from multiple investors is collected and invested in a diversified portfolio of stocks, bonds, or other securities by professional fund managers.
Types of Mutual Funds:
Equity Funds: Invest primarily in stocks; higher risk, higher potential returns.
Debt Funds: Invest in bonds, government securities, and fixed-income instruments; lower risk, moderate returns.
Hybrid Funds: Mix of equity and debt; balance of risk and return.
Sectoral/Thematic Funds: Focus on specific sectors (like technology, pharma) or themes (like ESG investing).
Index Funds & ETFs: Track market indices; passive management; low expense ratio.
Key takeaway: Understanding the type of fund helps align investments with your financial goals and risk tolerance.
2. Define Your Investment Goals
Choosing mutual funds smartly begins with clarity about your financial objectives.
Short-term Goals (0–3 years): Emergency fund, vacation, buying a car. Focus on low-risk funds like debt or liquid funds.
Medium-term Goals (3–7 years): House down payment, higher education. Consider hybrid or balanced funds.
Long-term Goals (7+ years): Retirement, wealth creation. Equity funds or index funds are suitable for long-term growth.
Tip: Always match the fund’s investment horizon with your financial goal horizon.
3. Assess Your Risk Appetite
Risk tolerance is crucial for fund selection.
High-risk appetite: Can tolerate volatility for higher returns → Equity or sectoral funds.
Moderate-risk appetite: Comfortable with some fluctuations → Balanced or hybrid funds.
Low-risk appetite: Prefer stable returns → Debt funds or government securities.
Important: Assess your risk not just financially but emotionally. Some investors panic during market dips.
4. Analyze Fund Performance
Past performance is not a guarantee, but it indicates the fund manager’s skill.
Look for consistency: Check returns over 1, 3, 5, and 10 years.
Compare with benchmarks: A good equity fund should outperform its benchmark index.
Evaluate risk-adjusted returns: Use metrics like Sharpe Ratio or Standard Deviation.
Example: A fund that gives 12% annual return with moderate volatility is preferable to a 15% return fund with extreme fluctuations.
5. Evaluate the Fund Manager
A skilled fund manager can make a huge difference in returns.
Experience matters: Check the manager’s track record over different market cycles.
Fund house reputation: Trust established fund houses with strong research capabilities.
Fund manager tenure: Frequent changes may indicate instability.
Pro tip: A strong fund manager is particularly important in actively managed equity and sectoral funds.
6. Expense Ratio and Fees
Costs directly reduce your returns.
Expense Ratio: Annual fee charged by the fund for managing your money. Lower is better.
Exit Load: Fee for selling before a certain period. Avoid high exit loads if you plan to stay flexible.
Tip: Compare expense ratios across similar funds. Even a 1% difference compounds over long-term investments.
7. Tax Implications
Mutual fund investments are subject to taxes. Understanding them helps in smart planning.
Equity Funds:
Short-term capital gains (STCG) – 15% if held ≤1 year
Long-term capital gains (LTCG) – 10% on gains above ₹1 lakh if held >1 year
Debt Funds:
STCG – Taxed as per income slab if held ≤3 years
LTCG – 20% with indexation if held >3 years
ELSS Funds:
Equity-linked savings scheme; 3-year lock-in; tax-saving benefit under Section 80C
Smart strategy: Use tax-efficient funds to reduce liabilities and increase net returns.
8. Diversification and Portfolio Strategy
Diversification reduces risk without sacrificing returns.
Across Asset Classes: Mix equity, debt, and hybrid funds.
Within Equity: Invest in large-cap, mid-cap, and small-cap funds.
Geographic Diversification: Some funds invest globally, reducing dependence on a single economy.
Example: A portfolio with 50% large-cap equity, 20% mid/small-cap, 20% debt, and 10% international equity balances growth and stability.
9. Check the Fund’s Investment Style
Understanding the fund’s style helps anticipate performance in different markets.
Equity Funds: Growth vs. Value, Large-cap vs. Mid-cap vs. Small-cap
Debt Funds: Duration strategy – short-term, medium-term, or long-term
Hybrid Funds: Equity-Debt ratio and rebalancing frequency
Pro tip: Align the style with market conditions and your risk tolerance.
10. Review Fund Ratings and Research Reports
Independent fund ratings provide a quick insight into quality.
Agencies: CRISIL, Morningstar, Value Research
Ratings reflect: Past performance, volatility, fund manager expertise, and consistency
Use as a guide: Not a sole decision factor
11. Monitor and Rebalance Regularly
Investing smartly doesn’t end at selection.
Track Performance: Review quarterly or semi-annually
Rebalance Portfolio: Adjust allocation as goals, risk tolerance, or market conditions change
Avoid Emotional Decisions: Don’t panic during market downturns; focus on long-term goals
12. SIPs vs. Lump Sum Investment
Systematic Investment Plans (SIPs) are generally safer for new investors.
SIP: Regular, smaller investments; reduces impact of market volatility via rupee-cost averaging
Lump Sum: One-time investment; better if markets are undervalued or for experienced investors
Smart choice: For beginners or long-term wealth creation, SIPs in equity or hybrid funds are ideal.
13. Beware of Marketing Hype
Avoid choosing funds based on:
Short-term performance or “hot” recommendations
Celebrity endorsements or ads
Peer pressure
Smart investors: Focus on fundamentals, not hype.
14. Tools to Aid Smart Selection
Several online platforms can help in research:
Morningstar, Value Research, Moneycontrol: Fund performance, ratings, comparison
Robo-advisors: Personalized fund recommendations based on risk profile and goals
Mutual fund apps: For SIPs, monitoring, and portfolio tracking
15. Case Study: Smart vs. Hasty Choice
Investor A: Chose fund based on last year’s 40% return. Fund dropped 25% next year → panic sold → loss realized.
Investor B: Analyzed 5-year performance, fund manager experience, risk-adjusted returns → consistent 12–15% returns → held long-term → wealth accumulation.
Lesson: Smart selection focuses on consistency, not short-term gains.
16. Final Checklist Before Investing
Define your goal and time horizon
Assess risk tolerance
Understand fund type and strategy
Analyze past performance and fund manager
Compare expense ratios and fees
Evaluate tax implications
Ensure diversification
Start with SIP or lump sum wisely
Monitor periodically and rebalance
Conclusion
Choosing mutual funds smartly is less about luck and more about informed decision-making. By understanding your goals, assessing risk, analyzing funds carefully, and maintaining discipline, investors can achieve consistent returns and long-term wealth creation. Smart investors don’t chase hype—they focus on research, planning, and patience. Mutual funds, when selected and managed intelligently, are a powerful tool for financial freedom.
ETHUSD: Where Price Could Go?4h tf
ETHUSD has bounced back strongly from around $3,826 after completing an A-B-C wave pattern. Right now, the price is testing resistance near $4,756. It could drop a little to around $4,440 before moving higher again. If the uptrend continues, the next target levels are $4,955, $5,300, and $5,500.
Stay tuned!
Thank you,
@Money_Dictators

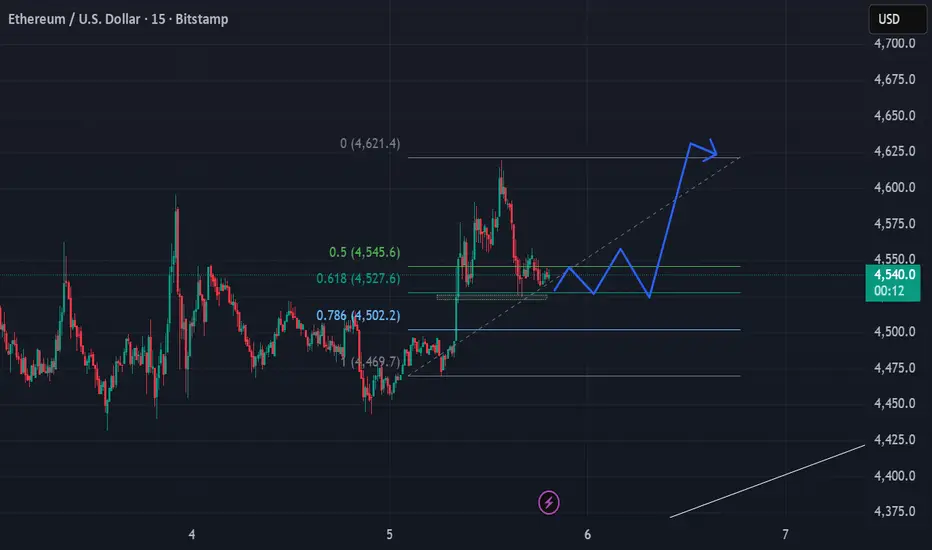
Don't miss this move on Ethereum!!!Price is consolidating on the golden level zone of Fibonacci.
If there is a good bullish candle on after the breakout of consolidation with a good liquidity sweep, go for long!
ETHUSD - Buy Side Entry ZonesETHUSD – Bullish Momentum With Premium Entry Zones 🚀
📍 Bias: Bullish
📍 Pair: ETH/USD
📆 Timeframes: 15m | 4H | 1D | 1W
---
🧭 Multi-Timeframe Context
ETHUSD is showing strong bullish structure on the 4H, Daily, and Weekly timeframes.
Buyers clearly dominate the market right now — every dip is being aggressively bought, and structure is aligned across all major TFs.
This alignment gives us high-probability long setups, especially when paired with clean Order Block + Market Structure Shift entries.
---
🧱 Key Bullish Order Blocks
1️⃣ Breaker Block + Order Block Zone → 4074 – 4248
This zone aligns with a bullish breaker block and previous structure flip area.
A strong reaction from here can fuel the next impulsive leg up.
2️⃣ Deeper OB Zone → 4044 – 3927
Acts as a secondary accumulation zone if price retraces deeper.
Perfect area for scaling in or catching a discounted entry.
---
📈 Execution Plan
Wait for LTF (15-Min) Market Structure Shift inside either OB zone.
Enter on bullish break + retest confirmation to align lower timeframe momentum with higher timeframe trend.
Keep stops below the OB zone you choose to trade, and target new highs in alignment with the macro trend.
> 💡 Remember: Don’t chase green candles — let the market come to your zones and show intent before execution.
---
⚠️ Final Note
With all higher timeframes bullish and clean OB zones below, ETHUSD is setting up for continuation plays. Patience and structured execution on LTF will give the best RR setups.
---
🚀 Bulls are in control — now it’s about precision entries.
#ETHUSD #TradingView #SmartMoneyConcepts #OrderBlocks #PriceAction #CryptoTrading

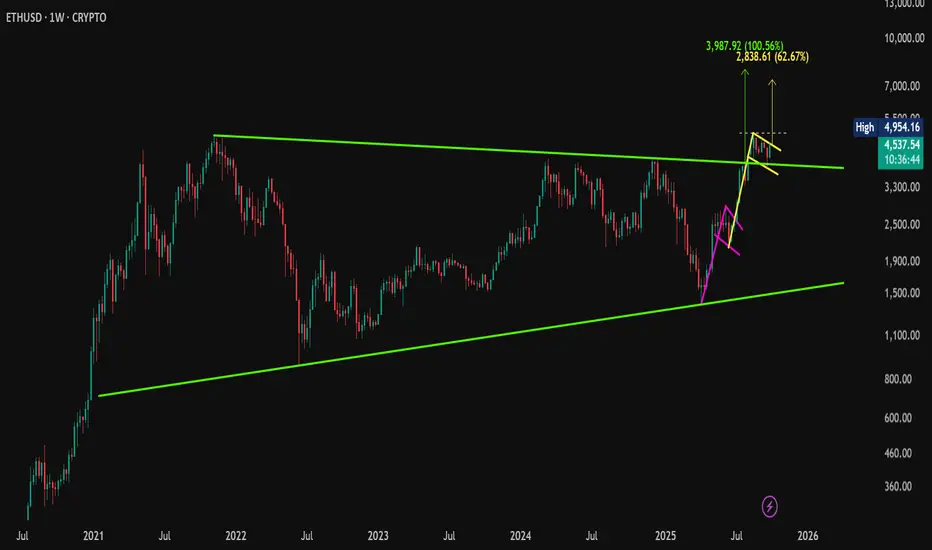
ETH Triangle Breakout + Bull Flag Setup – Is $8K Next?CMP: $4,540
Ethereum has broken out of a long-term symmetrical triangle , retested the trendline, and is now moving higher — signaling strong bullish momentum.
🔹 Breakout Retest Done – ETH completed a clean breakout and retest of the triangle resistance.
🔹 Bull Flags – Two bullish continuation flags have formed. The second flag is on the verge of breaking out , hinting at another potential leg up.
🔹 Pattern Targets –
• Bull Flag target: $7,365 +, if breakout confirms.
• Symmetrical Triangle target: $7,950 , which is over 62% above current price.
🟢 Key Level to Watch: A weekly close above $4,954.16 (previous ATH) would further validate the bullish structure.
#ETH | #Ethereum | #Crypto | #Breakout | #ChartPatterns | #SymmetricalTriangle | #BullFlag | #PriceAction
📌 Disclaimer: This analysis is shared for educational purposes only. It is not a buy/sell recommendation. Please do your own research before making any trading decisions.
A bullish TA for EthereumThe price has successfully broken above the "Neck line". This breakout is a confirmation signal for the double bottom pattern, suggesting a potential trend reversal to the upside.
Several potential price targets for the completion of Wave 5. These bullish targets include:
4,929.47
5,068.66
5,133.26
5,166.99
5,370.77
Also indicates a potential failure point for this bullish scenario. If the price were to reverse and break down below the double bottom lows, the downward-pointing Fibonacci extension levels suggest potential bearish targets at:
3,656.23
3,582.49

ETHEREUM COULD SEE 6000 Soon We may see strong 3rd wave towards 6000/8000 soon as the volatality increase .
3rd wave Personality we have seen from 3850 low if the pressure towards high intake we may see new high by end of the year .

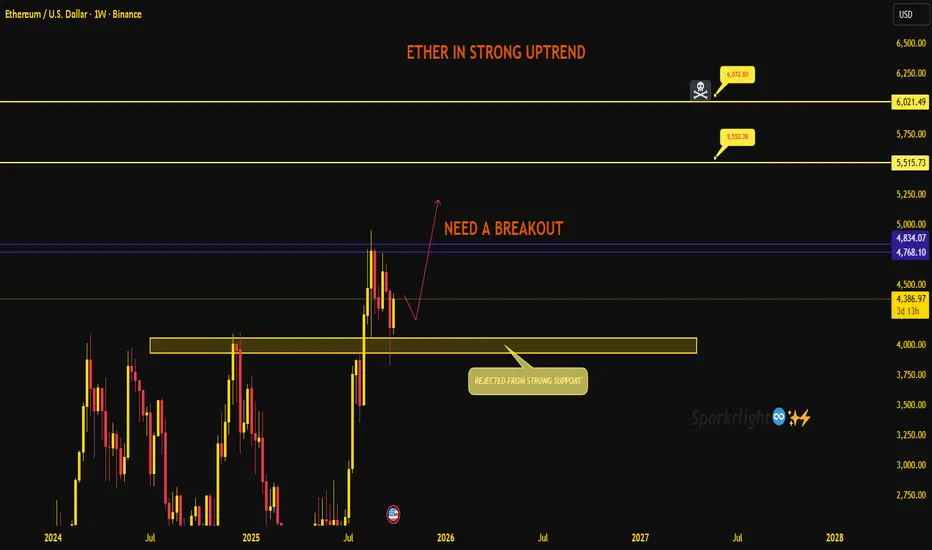
Ethereum – Strong Uptrend but Needs a Breakout!!Ether is still holding its strong uptrend, and the recent rejection from support has kept the bullish structure intact. The bigger picture remains positive, but short-term price action now demands a clear breakout to confirm continuation.
Current structure:
Price bounced cleanly from the 4000 zone, showing that buyers are defending the base.
The rally stalled just below the 4800–4850 resistance. This is the key barrier that needs to give way for the next leg higher.
Until then, we are stuck in a consolidation between strong support below and heavy resistance above.
Key levels to track:
Support: 4050–3950. As long as this zone holds, bulls keep the upper hand.
Breakout zone: 4768–4834. A weekly close above here should trigger momentum buyers.
Upside targets: 5515 → 5550, and if momentum extends, 6,000+.
Short-term view:
Ethereum is in a strong trend but needs that breakout above 4,800 to unlock the next wave higher. If buyers fail to push through, expect more back-and-forth action near support before another attempt.
The structure favors patience – wait for the breakout confirmation rather than chasing inside the range. Trade safe.
Part 8 Trading Master ClassPart 1: Introduction to Option Trading
Options are financial derivatives that derive their value from an underlying asset such as stocks, indices, commodities, or currencies. Unlike shares, buying an option doesn’t mean you own the asset—it gives you the right but not the obligation to buy or sell the asset at a pre-agreed price within a set period. This flexibility makes options a powerful tool for hedging, speculation, and income generation.
Part 2: What is a Derivative?
A derivative is a financial contract whose value depends on another asset. Futures and options are the two most popular derivatives. While futures require you to buy/sell at expiry, options give you the choice. This “choice” is what makes them unique—and sometimes tricky.
Part 3: The Two Types of Options
Call Option – Gives the buyer the right to buy an asset at a fixed price (strike price).
Example: If you buy a call option of Reliance at ₹2500, and the stock moves to ₹2600, you can still buy it at ₹2500.
Put Option – Gives the buyer the right to sell an asset at a fixed price.
Example: If you buy a put option at ₹2500 and the stock falls to ₹2400, you can still sell it at ₹2500.
Part 4: Key Terminologies
Strike Price – The pre-decided price of buying/selling.
Premium – The cost paid to buy the option.
Expiry Date – The last date till which the option is valid.
In-the-Money (ITM) – Option has intrinsic value.
Out-of-the-Money (OTM) – Option has no intrinsic value.
At-the-Money (ATM) – Strike price is close to market price.
Part 5: Call Option in Detail
A call option is ideal if you expect the price of an asset to rise. Buyers risk only the premium paid, while sellers (writers) can face unlimited losses if prices rise sharply. Traders often buy calls for bullish bets and sell calls to earn premium income.
Part 6: Put Option in Detail
A put option is profitable when asset prices fall. Buyers of puts use them for protection against a market crash, while sellers hope prices won’t fall so they can pocket the premium. Investors holding stocks often buy puts as insurance against downside risk.
Part 7: How Option Premium is Priced
Option premium = Intrinsic Value + Time Value
Intrinsic Value: Actual value (e.g., if Reliance is ₹2600 and strike is ₹2500, intrinsic = ₹100).
Time Value: Extra cost traders pay for the possibility of favorable movement before expiry.
Pricing is also influenced by volatility, interest rates, and dividends.
Part 8: The Greeks in Options
The Greeks measure option sensitivity:
Delta – Measures how much option price moves for a ₹1 move in stock.
Gamma – Measures how delta changes with stock movement.
Theta – Measures time decay (options lose value as expiry approaches).
Vega – Measures sensitivity to volatility.
Rho – Measures sensitivity to interest rates.
Part 9: Why Traders Use Options
Options are versatile. Traders use them to:
Speculate on price movements with limited risk.
Hedge against adverse market moves.
Generate Income by selling options (collecting premiums).
Leverage positions with less capital compared to buying shares directly.
Part 10: Buying vs Selling Options
Buying Options: Limited risk (premium), unlimited profit potential.
Selling Options: Limited profit (premium), unlimited risk.
Example: Selling a naked call when markets rise aggressively can cause heavy losses.

History and Evolution of Crypto Markets1. Precursors to Cryptocurrency
1.1 Early Concepts of Digital Money
The idea of digital money predates blockchain technology. Early attempts to create decentralized digital currencies emerged in the 1980s and 1990s. Notable examples include:
DigiCash (1989): Developed by David Chaum, DigiCash was an electronic cash system emphasizing privacy through cryptographic techniques. Despite its innovation, DigiCash failed commercially due to regulatory challenges and lack of adoption.
e-gold (1996): E-gold allowed users to transact in a gold-backed digital currency. It gained significant traction but ultimately faced legal issues related to money laundering, illustrating the challenges of regulating digital currencies.
1.2 Cryptography and the Idea of Decentralization
The foundational technology behind cryptocurrencies—cryptography—had been developing since the 1970s. Public key cryptography, hash functions, and digital signatures made secure, verifiable digital transactions possible. Visionaries like Wei Dai and Nick Szabo proposed concepts such as b-money and bit gold, which laid the groundwork for a decentralized digital currency system.
2. The Birth of Bitcoin
2.1 Satoshi Nakamoto and the White Paper (2008)
The official history of cryptocurrencies begins with Bitcoin. In 2008, an individual or group using the pseudonym Satoshi Nakamoto published the Bitcoin white paper, titled “Bitcoin: A Peer-to-Peer Electronic Cash System.”
Key innovations included:
Decentralization: Bitcoin operates without a central authority.
Blockchain: A distributed ledger ensures transparency and immutability.
Proof-of-Work: A consensus algorithm secures the network against double-spending.
Limited Supply: Bitcoin’s capped supply of 21 million coins created scarcity.
2.2 Launch and Early Adoption (2009–2011)
Bitcoin’s genesis block was mined in January 2009, marking the birth of the cryptocurrency ecosystem. Early adopters were primarily technologists, libertarians, and cryptography enthusiasts. Bitcoin’s first real-world transaction occurred in May 2010 when Laszlo Hanyecz bought two pizzas for 10,000 BTC, now famously remembered as the first commercial Bitcoin transaction.
By 2011, Bitcoin’s market gained visibility, reaching parity with the US dollar and spawning the first alternative cryptocurrencies, or altcoins, such as Litecoin, which introduced faster transaction times.
3. Expansion of the Crypto Ecosystem
3.1 Altcoins and Innovation (2011–2013)
Following Bitcoin’s success, thousands of alternative cryptocurrencies emerged, each seeking to improve upon Bitcoin’s limitations:
Litecoin (2011): Faster block generation, lower transaction fees.
Ripple (2012): Focused on cross-border payments and institutional adoption.
Namecoin (2011): Introduced decentralized DNS systems.
These early experiments diversified the ecosystem and demonstrated that blockchain could be used for purposes beyond simple peer-to-peer currency.
3.2 Early Exchanges and Market Development
Cryptocurrency exchanges began to appear, enabling users to trade digital assets:
Mt. Gox (2010): Initially a platform for trading Magic: The Gathering cards, it became the largest Bitcoin exchange by 2013, handling over 70% of global BTC transactions.
BTC-e and Bitstamp: Provided additional liquidity and infrastructure for crypto markets.
Exchanges played a critical role in establishing market prices, liquidity, and accessibility for retail investors.
4. The ICO Boom and Ethereum (2013–2017)
4.1 Ethereum and Smart Contracts
In 2013, Vitalik Buterin proposed Ethereum, a blockchain platform with the ability to execute smart contracts—self-executing code that runs on a decentralized network. Launched in 2015, Ethereum allowed developers to create decentralized applications (dApps), paving the way for:
Decentralized finance (DeFi)
Tokenized assets
Complex governance models
4.2 Initial Coin Offerings (ICOs)
Ethereum also enabled the rise of ICOs, where projects issued tokens to raise capital. Between 2016 and 2017, ICOs raised billions of dollars globally, creating a speculative boom. While many ICOs were successful, the market also experienced scams and failures, highlighting the risks of unregulated fundraising.
4.3 Market Maturation and Price Surges
By late 2017, Bitcoin’s price soared to nearly $20,000, and Ethereum exceeded $1,400. The market attracted mainstream media attention, institutional interest, and a wave of retail investors, marking the first major crypto market boom.
5. Market Correction and Regulatory Scrutiny (2018–2019)
5.1 The 2018 Crypto Winter
After the 2017 boom, the crypto market experienced a severe correction:
Bitcoin fell from ~$20,000 to below $4,000.
Many altcoins lost 80–90% of their value.
Market capitalization dropped from over $800 billion to under $200 billion.
5.2 Regulatory Developments
Governments began to recognize the need for regulation:
SEC (USA): Issued warnings about ICOs and classified some tokens as securities.
China: Banned ICOs and domestic cryptocurrency exchanges.
Japan and Switzerland: Introduced licensing frameworks for exchanges.
These measures aimed to protect investors while shaping the market’s infrastructure.
6. The Rise of DeFi, NFTs, and Layer 2 Solutions (2020–2022)
6.1 Decentralized Finance (DeFi)
DeFi platforms emerged, allowing financial services without intermediaries:
Lending and borrowing (Compound, Aave)
Decentralized exchanges (Uniswap, SushiSwap)
Yield farming and liquidity mining
DeFi introduced a new paradigm, where users could earn returns on their assets without traditional banks, but with increased smart contract and systemic risk.
6.2 Non-Fungible Tokens (NFTs)
NFTs became a cultural and financial phenomenon in 2021:
Enabled digital art ownership, collectibles, and gaming assets.
Opened new revenue streams for creators and introduced blockchain to mainstream audiences.
6.3 Layer 2 Solutions and Scaling
Blockchain networks faced congestion as DeFi and NFTs increased activity. Layer 2 scaling solutions (e.g., Polygon, Optimism) and alternative blockchains (e.g., Solana, Avalanche) emerged to reduce fees and increase transaction throughput.
7. Institutional Adoption and Mainstream Integration (2021–2023)
7.1 Institutional Interest
Large institutions began participating in crypto markets:
Companies like MicroStrategy, Tesla, and Square purchased Bitcoin as a reserve asset.
Investment banks and hedge funds launched crypto trading desks.
CME and Bakkt introduced futures and options on crypto.
7.2 Stablecoins and Payment Systems
Stablecoins, such as USDT, USDC, and BUSD, became essential for trading and payments:
Pegged to fiat currencies to reduce volatility.
Facilitated cross-border transactions and DeFi participation.
7.3 Regulatory Progress and Challenges
Governments increasingly engaged in policy formation:
US, EU, and Asia developed frameworks for taxation, anti-money laundering (AML), and investor protection.
Central Bank Digital Currencies (CBDCs) explored the integration of blockchain in sovereign monetary systems.
8. Crypto Market Volatility and Emerging Trends (2023–2025)
8.1 Market Cycles
The crypto market continued to exhibit volatility, driven by macroeconomic factors, technological upgrades, and speculative behavior. Bitcoin’s role as “digital gold” and Ethereum’s shift to proof-of-stake (Ethereum 2.0) shaped investor strategies.
8.2 Emerging Technologies
Web3 Applications: Decentralized social media, gaming, and marketplaces.
Layer 1 Innovations: Ethereum alternatives and sharding for scalability.
Interoperability Protocols: Cosmos, Polkadot, and cross-chain solutions enabling multi-chain ecosystems.
8.3 Societal and Cultural Impact
Cryptocurrencies influenced:
Financial inclusion, especially in developing countries.
New forms of digital identity and governance.
Debates on privacy, censorship, and the future of decentralized networks.
9. Key Lessons from the Evolution of Crypto Markets
Technological Innovation Drives Growth: Blockchain, smart contracts, and cryptography are central to adoption.
Speculation vs. Utility: Early markets were speculative; long-term adoption requires real-world use cases.
Regulation Shapes Markets: Legal clarity encourages institutional participation, while uncertainty can depress growth.
Market Volatility Is Normative: Cycles of boom and bust are inherent, reflecting immature markets and behavioral factors.
Decentralization Challenges Traditional Finance: Peer-to-peer finance, decentralized governance, and tokenized assets redefine financial norms.
10. Future Outlook
10.1 Institutional and Retail Integration
The trend of institutional adoption is expected to continue, alongside growing retail participation through user-friendly platforms and fintech integration.
10.2 Technological Evolution
Layer 2 and interoperability solutions will enhance scalability.
Blockchain-based AI, IoT, and supply chain solutions may drive new use cases.
10.3 Regulation and Mainstream Acceptance
Clearer regulatory frameworks may reduce risk and encourage long-term investment.
CBDCs may coexist with decentralized cryptocurrencies, creating a hybrid financial ecosystem.
10.4 Global Economic Implications
Cryptocurrencies could reshape monetary policy, capital flows, and global finance.
Digital assets may provide new tools for financial inclusion and cross-border trade.
Conclusion
The history and evolution of crypto markets illustrate a journey from obscure digital experiments to a sophisticated, multifaceted global financial ecosystem. Innovations in blockchain, cryptography, and decentralized finance, coupled with cultural adoption and regulatory adaptation, have transformed cryptocurrency from a niche concept into a mainstream asset class. While volatility and uncertainty remain, the trajectory suggests continued integration with traditional finance, technological innovation, and societal influence.
The crypto market’s evolution is ongoing, reflecting broader trends in technology, finance, and global governance. Understanding its history provides critical insights into its future potential and the challenges it may face in shaping the next generation of financial systems.
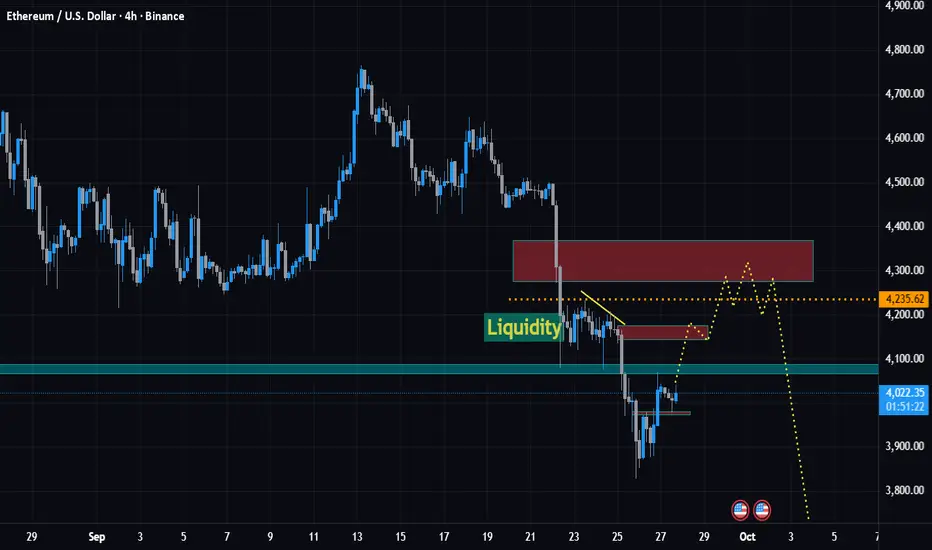
ETHUSDT SELL SETUP – 4H Time Frame AnalysisETHUSDT is currently respecting a clear downtrend on the 4H chart, fully aligned with the Daily Breaker Block rejection near 4100.
After the sharp rejection, price action suggests a possible retracement move back into the premium levels before continuation to the downside.
Key Levels to Watch
Liquidity Sweep Zones: 4200 – 4235
Fibonacci 0.5 Retracement: lining up with the supply/FVG area
Stop-Loss Placement: Above 4250 (structure invalidation)
Target Zones: Next liquidity pools lower on the 4H
Strategy Plan
We wait for ETH to retrace into the 0.5 FIB + 4200–4235 liquidity sweep zone. If confirmed by strong bearish candles on 4H and fractal shifts on 1H, this creates a high-probability sell setup.
Trade Idea
Sell Zone: 4200 – 4235
Stop-Loss: 4250+
Take-Profit: Trail into liquidity downside, minimum R:R 1:2+
Confirmation: Watch fractals on 1H for entry precision.
Conclusion
ETH remains bearish in the mid-term. Any pullback into the 4200–4235 liquidity zone should be viewed as a selling opportunity until structure changes. Patience for confirmation is key—wait for liquidity sweep + bearish rejection before entry.
⚠️ Not Financial Advice – Educational Purpose Only
Ye TradingView ke liye short, crisp aur engaging hai — viral hone ke liye clear levels, FVG + liquidity + fractal angle add kiya hai 🔥
Part 1 Support and Resistance1. Introduction to Options Trading
Options are financial derivatives that give traders the right, but not the obligation, to buy (Call Option) or sell (Put Option) an underlying asset at a pre-decided price (strike price) within a specific time frame. Unlike shares where you own the asset, options provide flexibility to speculate, hedge, or generate income. Options derive their value from underlying assets like stocks, indices, commodities, or currencies, making them versatile but also complex.
2. The Nature of an Option Contract
Each option contract has four key elements:
Underlying Asset (e.g., Reliance stock, Nifty index).
Strike Price (predetermined buy/sell level).
Premium (price paid to buy the option).
Expiration Date (last valid trading day).
This structure allows traders to choose different risk/reward setups, unlike shares where profit and loss move linearly with price.
3. Call Options Explained
A Call Option gives the buyer the right to purchase the underlying asset at the strike price. For example, buying a Nifty 20,000 Call at ₹100 means you expect Nifty to rise above 20,100 (strike + premium). If it rises, profit potential is unlimited, but loss is capped at ₹100 (the premium paid). This asymmetry makes calls powerful for bullish strategies.
4. Put Options Explained
A Put Option gives the buyer the right to sell the underlying asset at the strike price. Example: buying a TCS ₹3500 Put at ₹80 means you profit if TCS falls below ₹3420 (strike – premium). Put buyers use it for bearish bets or hedging existing long positions. Loss is capped to premium, profit grows as price declines.
5. The Role of Option Writers (Sellers)
Every option has two sides: the buyer and the seller (writer). Writers receive the premium but take on significant obligations. A call writer must sell at strike price if exercised; a put writer must buy. Sellers have limited profit (premium received) but potentially unlimited losses (especially in calls). Option writers dominate because most options expire worthless, but the risk is substantial.
6. Intrinsic Value and Time Value
An option’s premium has two parts:
Intrinsic Value (IV): Actual profit if exercised now. Example: Reliance at ₹2600, Call strike at ₹2500 → IV = ₹100.
Time Value (TV): Extra premium due to potential future price movement. Near expiry, TV decays (time decay).
Understanding IV and TV is crucial for identifying overvalued/undervalued options.
7. Option Expiry and Settlements
Options in India (like Nifty, Bank Nifty) have weekly and monthly expiries. Stock options have monthly expiries. On expiry, in-the-money (ITM) options settle in cash (difference between spot and strike). Out-of-the-money (OTM) expire worthless. Expiry days often see volatile moves as traders adjust positions.
8. The Concept of Moneyness
Options are classified by their relation to the spot price:
In the Money (ITM): Strike favorable (e.g., Call strike below spot).
At the Money (ATM): Strike = spot.
Out of the Money (OTM): Strike unfavorable (e.g., Call above spot).
Moneyness influences premium, risk, and probability of profit.
9. Option Premium Pricing Factors
Option premium is influenced by:
Spot Price of the underlying.
Strike Price.
Time to Expiry.
Volatility (Implied & Historical).
Interest Rates and Dividends.
The Black-Scholes model and other pricing models quantify these variables, but in practice, demand-supply and implied volatility dominate.
10. The Greeks – Risk Management Tools
Option traders use Greeks to measure risk:
Delta: Sensitivity to underlying price.
Gamma: Rate of change of Delta.
Theta: Time decay impact.
Vega: Sensitivity to volatility changes.
Rho: Sensitivity to interest rates.
Greeks help traders build and manage complex strategies.

ETH LONG ETH long, buy at 4200 SL IS 4100 TARGET WILL BE 4500
ALL OFF THE NUMBERS ARE IN ROUND Figure
Don't avoid, it is a technical and phycological trade
Let's see guys ,how ETH will perform

What Are Trading Orders? A Beginner’s Guide1. Introduction to Trading Orders
A trading order is essentially an instruction from a trader to a broker or trading platform to buy or sell a financial instrument. Trading orders tell the broker:
What to trade (stock, commodity, currency, etc.)
How much to trade (quantity or lots)
When to trade (immediately or under certain conditions)
At what price (market price or specific price level)
Without an order, no trade can occur. Orders are the bridge between your trading strategy and execution in the market.
1.1 Why Trading Orders Matter
Trading orders are not just procedural—they affect your trading results. Correct order selection can:
Improve execution speed
Reduce slippage (difference between expected and actual price)
Control risk (through stop losses or limit orders)
Allow automation of trades for efficiency
Traders who understand how to use orders effectively can manage trades systematically rather than relying on guesswork or emotion.
1.2 Key Components of a Trading Order
Every trading order typically includes the following:
Type of Order: Market, limit, stop, etc.
Quantity/Size: How many shares, lots, or contracts to buy/sell.
Price Specification: At what price the order should be executed.
Duration/Validity: How long the order remains active (e.g., day order, GTC).
Special Instructions: Optional features like “all or none” (AON) or “immediate or cancel” (IOC).
Understanding these components ensures traders can communicate their intentions clearly to the market.
2. Types of Trading Orders
Trading orders can be broadly divided into market orders, limit orders, stop orders, and advanced orders. Each has distinct characteristics and uses.
2.1 Market Orders
A market order is an instruction to buy or sell immediately at the current market price. Market orders prioritize speed of execution over price.
Advantages:
Fast execution
Guaranteed to fill if liquidity exists
Disadvantages:
Price uncertainty, especially in volatile markets
Potential for slippage
Example:
You want to buy 100 shares of XYZ Corp, currently trading at ₹500. Placing a market order will buy shares at the next available price, which could be slightly higher or lower than ₹500.
2.2 Limit Orders
A limit order specifies the maximum price to buy or minimum price to sell. The trade executes only if the market reaches that price.
Advantages:
Controls execution price
Useful in volatile markets
Disadvantages:
May not execute if price is not reached
Missed opportunities if price moves away
Example:
You want to buy XYZ Corp at ₹495. A limit order at ₹495 will only execute if the price drops to ₹495 or below.
2.3 Stop Orders
Stop orders become market orders once a specific price is reached. They are primarily used to limit losses or lock in profits.
Stop-Loss Order: Sells automatically to prevent further loss.
Stop-Buy Order: Used in breakout strategies to buy when a price crosses a threshold.
Example:
You hold shares of XYZ Corp bought at ₹500. To prevent large losses, you place a stop-loss at ₹480. If the price falls to ₹480, your shares are sold automatically.
2.4 Stop-Limit Orders
A stop-limit order is a combination of stop and limit orders. Once the stop price is triggered, the order becomes a limit order instead of a market order.
Advantages:
Provides price control while using stops
Reduces risk of selling too low in volatile markets
Disadvantages:
Risk of not executing if price moves quickly beyond limit
Example:
Stop price: ₹480, Limit price: ₹478. If XYZ Corp drops to ₹480, the order becomes a limit order to sell at ₹478 or better.
2.5 Trailing Stop Orders
A trailing stop is dynamic, moving with the market price to lock in profits while limiting losses.
Useful for locking gains in trending markets
Automatically adjusts stop price as market moves favorably
Example:
You buy shares at ₹500 and set a trailing stop at ₹10. If the stock rises to ₹550, the stop automatically moves to ₹540. If the price then falls, the trailing stop triggers at ₹540.
2.6 Other Advanced Orders
One-Cancels-Other (OCO) Orders: Executes one order and cancels the other automatically. Useful for breakout or range trades.
Good Till Cancelled (GTC) Orders: Remain active until manually canceled.
Immediate or Cancel (IOC): Executes immediately, cancels unfilled portion.
Fill or Kill (FOK): Executes entire order immediately or cancels it completely.
These advanced orders allow traders to automate strategies and manage risk efficiently.
3. Order Duration and Validity
Trading orders are not indefinite. Traders must choose a duration for each order:
Day Order: Expires at market close if not executed.
Good Till Cancelled (GTC): Stays active until filled or manually canceled.
Good Till Date (GTD): Active until a specified date.
Immediate or Cancel (IOC): Executes immediately or cancels unfilled portion.
Choosing the right duration affects execution probability and risk management.
4. Choosing the Right Order Type
Choosing the appropriate order type depends on trading goals, market conditions, and risk tolerance.
For beginners: Market and limit orders are easiest to use.
For risk management: Stop-loss and trailing stops are essential.
For advanced strategies: OCO, FOK, and GTC orders help automate trades.
Key Considerations:
Market volatility
Liquidity of the asset
Time available to monitor trades
Risk tolerance
5. Practical Examples of Trading Orders
Let’s examine some real-life trading scenarios:
Buying at Market Price: You want instant execution for 50 shares of Infosys. Place a market order; shares execute at the best available price.
Buying at a Discount: You want to buy 50 shares of Infosys if the price falls to ₹1500. Place a limit order at ₹1500; the order executes only if the price drops.
Protecting Profits: You bought shares at ₹1500. To lock gains, you place a trailing stop at ₹50. If the price rises to ₹1600, the stop moves to ₹1550, securing profits if the price falls.
Breakout Strategy: You expect Infosys to rise above ₹1600. Place a stop-buy order at ₹1600. If the price crosses ₹1600, the order triggers and you enter the trade.
6. Risks and Considerations
Trading orders are powerful but not foolproof. Common risks include:
Slippage: Execution at a worse price than expected.
Partial fills: Only part of the order executes.
Liquidity risk: Low trading volume can prevent execution.
Overuse of stops: Placing stops too close may trigger premature exits.
Emotional trading: Avoid constantly changing orders based on fear or greed.
Mitigating these risks involves planning, strategy, and disciplined execution.
7. Technology and Trading Orders
Modern trading platforms have transformed order execution:
Electronic trading: Fast, accurate, with minimal human error.
Algorithmic trading: Automates orders based on pre-defined criteria.
Mobile trading apps: Allow order management on the go.
APIs: Enable advanced traders to execute complex strategies programmatically.
Technology makes trading more efficient but requires understanding to avoid mistakes.
8. Tips for Beginners
Start with market and limit orders.
Use stop-loss orders to manage risk.
Understand order duration and use GTC orders cautiously.
Avoid overcomplicating trades with too many advanced orders initially.
Practice on demo accounts before real capital.
Keep a trade journal to track order types, outcomes, and lessons.
Conclusion
Trading orders are the foundation of every trade. They bridge your strategy and market execution, determine price, timing, and risk control. Understanding the different types—market, limit, stop, stop-limit, trailing stops, and advanced orders—allows traders to execute strategies systematically. Combining the right order types with risk management, technology, and discipline empowers beginners to trade confidently and efficiently.
In essence, mastering trading orders is mastering the mechanics of trading. Without it, even the best strategies may fail. With it, even a novice trader can navigate financial markets with clarity and purpose.
Option Trading 1. Option Pricing
Options are priced using models like Black-Scholes and Binomial Models, which consider:
Current stock price
Strike price
Time to expiration
Interest rates
Dividends
Volatility (most important factor)
The “Greeks” – Sensitivity Measures
Delta – Measures how much the option price changes with a ₹1 move in the stock.
Gamma – Measures how delta changes with stock movement.
Theta – Time decay; how much value the option loses daily as expiration nears.
Vega – Sensitivity to volatility.
Rho – Sensitivity to interest rates.
2. Options in Hedging
Professional investors and institutions use options for risk management:
A fund manager holding a large stock portfolio may buy put options to protect against a market crash.
Exporters and importers use currency options to hedge exchange rate risks.
Airlines may use oil options to hedge against fuel price rises.
Options in India and Global Markets
In India, options are traded on NSE (National Stock Exchange) with contracts based on Nifty, Bank Nifty, and individual stocks.
Lot sizes are fixed by exchanges.
Global markets like the U.S. (CBOE) have highly liquid options markets, with more flexibility and variety.
3. Psychology in Option Trading
Successful option traders combine technical analysis, market structure, and psychology:
Patience is crucial because options decay with time.
Discipline is key to managing leverage.
Emotional trading often leads to overtrading and big losses.
4. Practical Example
Suppose Reliance stock is trading at ₹2,500.
You buy a call option with a strike price of ₹2,600 for ₹50 premium.
If Reliance rises to ₹2,800:
Profit = ₹200 – ₹50 = ₹150 per share.
If Reliance stays below ₹2,600:
Loss = ₹50 (premium only).
On the flip side, if you sell this option and Reliance jumps, you may face unlimited losses.

What is Zero Day Options (0DTE) trading?1. Understanding 0DTE Options
Definition
Zero Day to Expiration options are options contracts that expire on the same trading day they are purchased. For example, if today is Friday, and a trader buys a call option on the S&P 500 index with 0DTE, the contract will expire at the close of the market on Friday. Essentially, the lifetime of these contracts is measured in hours rather than days or weeks.
2. Mechanics of 0DTE Trading
2.1 Option Types Used
Most 0DTE trading occurs in index options (like SPX, NDX, RUT) rather than single-stock options because index options:
Have higher liquidity.
Feature smaller bid-ask spreads.
Are cash-settled, reducing the risk of assignment.
Traders can use calls, puts, or combinations (spreads, straddles, strangles) depending on their market outlook.
2.2 Pricing Dynamics
0DTE options pricing is primarily influenced by:
Intrinsic Value – The difference between the strike price and the current price of the underlying asset.
Time Value – With 0DTE, the time value approaches zero rapidly.
Implied Volatility (IV) – Small changes in volatility can significantly impact 0DTE option prices.
Theta Decay – The most crucial factor. Since expiration is hours away, Theta can erode the premium of out-of-the-money options almost instantly.
Mathematically, options pricing can be expressed using the Black-Scholes model, though traders must account for extreme sensitivity to small inputs for 0DTE options.
3. Why Traders Use 0DTE Options
3.1 Opportunities for Profit
0DTE options offer several profit opportunities:
Leverage – Small movements in the underlying asset can produce outsized gains.
Short-Term Hedging – Traders can hedge intraday positions without tying up capital for days.
Volatility Plays – Sudden market swings, news events, or macroeconomic announcements can create rapid profits.
3.2 Psychological Appeal
Many traders are drawn to 0DTE options because:
Fast results: Unlike traditional trades, results are immediate, satisfying the demand for quick feedback.
Excitement: The high-risk, high-reward nature can feel like active gambling, attracting thrill-seekers.
Scalping: They allow multiple trades in a single day, exploiting short-term inefficiencies.
4. Strategies for 0DTE Options
Trading 0DTE options requires precision, discipline, and advanced strategies. Common strategies include:
4.1 Directional Trades
Long Calls/Puts: Buying a call if bullish or a put if bearish. High potential reward but high Theta decay.
Intraday Scalping: Entering and exiting multiple positions based on minute-to-minute market moves.
4.2 Non-Directional Trades
Iron Condors: Selling an out-of-the-money call and put while buying further out-of-the-money options to limit risk. Works well in low-volatility scenarios.
Straddles/Strangles: Buying or selling both calls and puts at the same or different strike prices to profit from expected volatility.
4.3 Gamma Scalping
0DTE options have extremely high Gamma, meaning the Delta changes rapidly as the underlying moves. Professional traders may use gamma scalping to adjust positions dynamically for small, incremental profits.
4.4 Hedging
Traders can use 0DTE options to hedge larger positions. For instance, a trader holding a stock index position may buy a 0DTE put to protect against an intraday downside move.
5. Risk and Reward
5.1 Reward Potential
0DTE options can produce explosive returns, often multiples of the initial investment if the trade moves in favor within hours. Traders are drawn to scenarios where a 1% move in the underlying asset can yield 50–100% gains in the option.
5.2 Risks Involved
Rapid Theta Decay: Out-of-the-money options can become worthless in hours.
Market Noise: Small, unpredictable price movements can trigger losses.
Liquidity Risk: Despite high volume in index options, wide spreads can impact execution.
Psychological Stress: Extreme volatility can result in emotional decision-making.
5.3 Risk Management Techniques
Defined-Risk Strategies: Use spreads or iron condors to cap potential losses.
Position Sizing: Limit exposure to a small percentage of trading capital per trade.
Stop-Loss Orders: Implement strict stop-loss levels for intraday trades.
Exit Discipline: Since expiration is imminent, knowing when to exit is critical.
6. Market Conditions Favoring 0DTE Trading
0DTE options thrive in certain market conditions:
High Volatility: News releases, earnings, FOMC meetings, and geopolitical events.
Intraday Trends: Strong directional trends provide opportunities for quick profits.
Range-Bound Markets: Strategies like iron condors or short straddles capitalize on minimal movement.
Low Liquidity Events: Sometimes, lower liquidity can widen spreads, but careful traders exploit temporary inefficiencies.
7. Tools and Platforms
Effective 0DTE trading requires:
Advanced Trading Platforms: Real-time charts, fast execution, and option-specific analytics.
Level II Data: For seeing order book depth and anticipating short-term price action.
Option Greeks Tracking: Monitor Delta, Gamma, Theta, and Vega in real-time.
Algorithmic Support: Many traders use scripts or bots for precise entries and exits.
8. 0DTE Trading for Retail vs. Institutional Traders
8.1 Retail Traders
Drawn to high-reward potential.
Often over-leverage due to excitement.
Use simplified strategies like buying calls/puts.
8.2 Institutional Traders
Use 0DTE to hedge or adjust broader portfolios.
Employ gamma scalping and other sophisticated strategies.
Monitor systemic risk exposure across multiple assets.
9. Regulatory and Tax Considerations
0DTE trading is legal and regulated in most markets where options trading is allowed.
Frequent trading may trigger short-term capital gains taxes, often at higher rates than long-term gains.
Brokers may require higher margin due to the extreme risk.
10. Psychological Aspects
0DTE trading can induce high stress:
Rapid wins and losses can trigger emotional decision-making.
Traders must maintain discipline, avoid revenge trading, and adhere strictly to risk limits.
Journaling and post-trade analysis are essential to improve strategy over time.
11. Advantages and Disadvantages
11.1 Advantages
High leverage.
Immediate results.
Multiple trading opportunities per day.
Ideal for hedging short-term risk.
11.2 Disadvantages
Extremely high risk of total loss.
Requires constant monitoring and fast execution.
Emotional and psychological strain.
Not suitable for beginners without proper education.
12. Case Study: SPX 0DTE Trading
Suppose the S&P 500 index is at 4,500. A trader buys a 4,510 call option expiring in 0DTE:
Premium Paid: $2 per contract.
Scenario 1: Index moves to 4,520 within hours → Option premium may jump to $12 → Profit: $1,000 per contract.
Scenario 2: Index moves down to 4,495 → Option expires worthless → Loss: $200 per contract.
This illustrates both the reward potential and risk inherent in 0DTE trading.
13. Best Practices
Trade liquid instruments like SPX, NDX, or RUT.
Stick to defined-risk strategies to avoid catastrophic losses.
Focus on short, disciplined trades, avoiding overexposure.
Use technical analysis for intraday patterns.
Stay aware of economic events that can cause sudden volatility.
Keep a trading journal to evaluate performance and refine strategies.
Conclusion
Zero Day to Expiration (0DTE) options trading represents the frontier of intraday derivatives trading. With extreme leverage, rapid time decay, and the ability to exploit minute-to-minute market movements, 0DTE options offer tremendous potential for profits—but equally, they carry formidable risks. Successful 0DTE trading demands knowledge, discipline, risk management, and psychological resilience.
While 0DTE trading is not suited for everyone, when approached methodically, it provides both retail and institutional traders with powerful tools for hedging, speculation, and tactical profit-making. In an era of fast-moving markets, 0DTE options have cemented their place as a central instrument for aggressive, high-frequency trading strategies.

ETH BIG HAMMERAfter good correction ETH has made a hammer at the previous liquidity zone (Support).
One can look for Buy on dip from here on in ETH.
SL- 4070
Target- 4300, 4370, 4400
Disclaimer- This is just for Education Purpose.
Follow for mor such content and learnings.
Jai Shree Ram.

Ethereum 1 Week View📊 Weekly Timeframe Technical Overview
On the weekly chart, ETH has recently achieved its highest weekly close in four years, signaling strong bullish momentum.
🔄 Key Support and Resistance Levels
Support Levels: The primary support zone lies between $4,150 and $4,200, with additional support around $4,000.
Resistance Levels: Immediate resistance is observed around $4,500, with stronger resistance near $4,700–$4,760 .
📈 Technical Indicators
Relative Strength Index (RSI): The 14-day RSI is approximately 51.58, indicating neutral momentum
Moving Averages: Short-term moving averages (5-day, 10-day) are above the current price, suggesting potential resistance, while longer-term averages (50-day, 100-day, 200-day) are below, indicating support
MACD: The MACD is positive, supporting a bullish outlook
🧭 Market Sentiment
Analysts are closely monitoring the Federal Open Market Committee (FOMC) meeting this week, as a dovish stance could bolster risk assets like ETH, potentially driving prices toward the $4,700–$4,800 range
📅 Price Forecast
Analytical forecasts suggest that ETH may reach approximately $4,311.84 within a week and $4,520.26 within four weeks.

Understanding Fundamental Market Concepts1. Introduction to Financial Markets
Financial markets are platforms where buyers and sellers come together to trade financial instruments. They provide liquidity, transparency, and price discovery, ensuring efficient allocation of resources. Markets are not limited to stocks; they include bonds, commodities, currencies, and derivatives.
Purpose of Financial Markets
Capital formation: Businesses raise funds to expand operations or invest in projects.
Price discovery: Market prices reflect supply-demand dynamics and underlying value.
Liquidity: Investors can quickly buy or sell assets.
Risk transfer: Instruments like derivatives help shift or manage financial risk.
Economic growth: Efficient markets channel capital to productive sectors.
Types of Financial Markets
Stock markets: Trading of company shares.
Bond markets: Trading of debt securities.
Commodity markets: Trading raw materials like metals, energy, and agriculture.
Foreign exchange markets: Currency trading.
Derivatives markets: Trading contracts based on underlying assets.
2. Key Participants in Financial Markets
Understanding participants helps in analyzing market dynamics.
1. Retail Investors
Individuals trading their personal capital.
Motivated by wealth creation, savings growth, or speculation.
2. Institutional Investors
Mutual funds, hedge funds, insurance companies, and pension funds.
They control large capital pools and influence market trends.
3. Brokers and Market Makers
Brokers: Facilitate buying and selling for clients.
Market makers: Provide liquidity by quoting buy and sell prices.
4. Regulators
Ensure market transparency, fairness, and stability.
Examples: SEBI (India), SEC (USA), FCA (UK).
3. Stocks: Ownership in Companies
Stocks, also called equities, represent ownership in a company. Investing in stocks allows individuals to participate in company profits and growth.
Types of Stocks
Common stocks: Voting rights and dividends.
Preferred stocks: Fixed dividends, limited voting rights.
Stock Valuation Metrics
Market Capitalization: Stock price × total shares.
Price-Earnings (P/E) Ratio: Price per share ÷ earnings per share (EPS).
Book Value: Net asset value per share.
Dividend Yield: Annual dividend ÷ stock price.
Stock Indices
Represent performance of a group of stocks.
Examples: Nifty 50, S&P 500, Dow Jones Industrial Average.
Indices serve as benchmarks for investment performance.
Stock Trading Mechanisms
Conducted through stock exchanges like NSE, BSE, NYSE, or NASDAQ.
Primary market: Companies issue shares via IPOs to raise capital.
Secondary market: Existing shares are traded among investors.
4. Bonds and Fixed-Income Instruments
Bonds are debt instruments issued by governments or corporations to raise funds. Investors lend money to issuers and receive periodic interest payments.
Key Bond Concepts
Face value: Amount paid at maturity.
Coupon rate: Interest paid to bondholders.
Yield: Return on investment.
Credit rating: Risk assessment by agencies like Moody’s or S&P.
Types of Bonds
Government bonds (low risk).
Corporate bonds (higher returns, moderate risk).
Municipal bonds (tax advantages in some countries).
Advantages of Bonds
Lower risk than stocks.
Regular income through interest.
Diversification for a balanced portfolio.
5. Commodity Markets
Commodity markets trade raw materials critical for global industries.
Types of Commodities
Metals: Gold, silver, copper.
Energy: Oil, natural gas, coal.
Agricultural: Wheat, coffee, cotton.
Price Determinants
Supply-demand imbalance.
Weather and natural disasters.
Geopolitical events.
Currency fluctuations (especially USD).
Trading Mechanisms
Spot markets: Immediate delivery.
Futures markets: Agreements to buy/sell at future dates.
6. Foreign Exchange Markets
The forex market is the largest global financial market, facilitating currency exchange for trade, investment, and speculation.
Key Concepts
Exchange rate: Value of one currency in terms of another.
Currency pairs: e.g., EUR/USD, USD/INR.
Spot rate vs. forward rate: Immediate vs. future delivery.
Market Participants
Central banks (e.g., RBI, Fed) controlling monetary policy.
Commercial banks facilitating trade and hedging.
Retail and institutional traders speculating on currency movements.
7. Derivatives: Managing Risk
Derivatives are financial instruments whose value is derived from underlying assets (stocks, bonds, commodities, currencies).
Types of Derivatives
Futures: Obligatory contract to buy/sell at a future date.
Options: Right, but not obligation, to buy/sell at a predetermined price.
Swaps: Exchange of cash flows between parties (e.g., interest rate swaps).
Forwards: Customized contracts for future transactions.
Purpose of Derivatives
Hedging: Protect against price fluctuations.
Speculation: Profit from price movements.
Arbitrage: Exploit price differences between markets.
8. Market Analysis Techniques
Investors use multiple approaches to evaluate markets and select investments.
1. Fundamental Analysis
Evaluates intrinsic value based on economic, financial, and industry factors.
Key metrics: Earnings, revenue growth, P/E ratio, debt levels.
Macro factors: Inflation, GDP growth, interest rates, unemployment.
2. Technical Analysis
Studies historical price and volume patterns to predict future movements.
Tools: Candlestick charts, moving averages, RSI, MACD.
3. Sentiment Analysis
Gauges investor mood using news, surveys, and social media trends.
Important for predicting short-term market movements.
9. Risk and Money Management
Effective risk management ensures sustainable returns and protects capital.
Types of Market Risk
Market risk: Loss due to price movements.
Credit risk: Borrower fails to repay.
Liquidity risk: Inability to sell assets quickly.
Operational risk: Failures in systems or processes.
Risk Mitigation Techniques
Diversification: Spread investments across sectors and asset classes.
Position sizing: Invest proportionally to portfolio value.
Stop-loss orders: Limit potential losses on trades.
10. Global Market Awareness
Markets are increasingly interconnected, influenced by global economic and geopolitical developments.
Key Influencers
Global indices: S&P 500, FTSE 100, Nikkei 225 indicate economic trends.
Currency movements: Affect trade and multinational companies.
Central bank policies: Interest rate changes and quantitative easing impact markets.
Geopolitical events: Wars, elections, trade agreements affect market sentiment.
Importance
Investors must track international trends to make informed decisions.
Global awareness aids in risk diversification and long-term strategy planning.
11. Financial Products and Instruments
Investors have multiple options to gain exposure to markets:
Mutual funds: Pooled investment managed by professionals.
Exchange-Traded Funds (ETFs): Traded like stocks, tracking indices or commodities.
Real Estate Investment Trusts (REITs): Income from property portfolios.
SIP (Systematic Investment Plan): Periodic investment in mutual funds.
IPOs and FPOs: Opportunities to invest in companies at the primary market level.
These products help investors tailor risk-return profiles to their financial goals.
12. Building a Market Mindset
Successful investors develop a disciplined mindset:
Patience: Long-term wealth creation over short-term gains.
Continuous learning: Understanding evolving market trends.
Adaptability: Adjusting strategies based on economic changes.
Analytical thinking: Making decisions based on data, not emotions.
Conclusion
Mastering fundamental market concepts involves understanding market structures, instruments, participants, and analysis techniques. Investors equipped with this knowledge can navigate stocks, bonds, commodities, forex, and derivatives, balancing risk and return. Global awareness, disciplined risk management, and continuous learning are essential for sustainable market success.
The world of financial markets may appear complex initially, but breaking it down into structured learning—starting with basic concepts and progressing to global strategies—enables anyone to become a confident, informed market participant.
ETH again in trap Zone ETH has fallen as expected in last analysis, but now it is stuck in no trade zone or trap Zone, if we plan long at fibonacci 50% retracement we can expect a short good move ,or it we only can go up after trendline breakout
Disclaimer. This idea is only for education purpose only not for trading loss and profit

ETHUSD 2.5R sell side trade scenarioETHUSD is forming sell side trades as current bias and draw on liquidity both are at down side. Price has also left SIBIs to attract price upside for a while and then return back to target. In weekend price may have low volatility and trade possibly generate on Monday or later.
1. There is a daily time frame bearish FVG.
2. There is bearish FVG in 4H TF. Now price is approaching it slowly.
3. These FVGs are forming inside OTE zone.
4. Order flow is bearish. And draw on liquidity is also at downside.
5. Most probably price will take liquidity of FVGs and create MSS/CISD/TS/iFVG in LTF.
6. Price should show rejection/reversal in LTF (5m,1m) at FVG zone.
7. BTC is also forming similar scenario.
All these combinations are signalling a high probability and 2.5R trade scenario.
Note – if you liked this analysis, please boost the idea so that other can also get benefit of it. Also follow me for notification for incoming ideas.
Also Feel free to comment if you have any input to share.
Disclaimer – This analysis is just for education purpose not any trading suggestion. Please take the trade at your own risk and with the discussion with your financial advisor.

ETH long ETH may touch fib 618 level that is 4510 then it can bounce back to 4575 stoploss can be set at 4490
