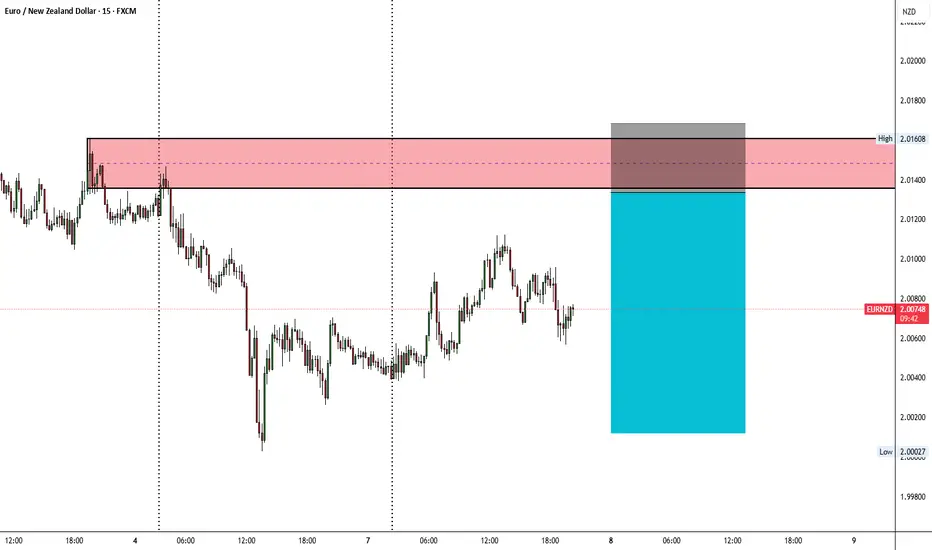
SELL ENTRY - EURNZD🔻 SELL ENTRY - EURNZD 🔻
Price has tapped into a major supply zone after a clear bearish structure.
Expecting rejection from this premium area for a continuation to the downside.
📊 Timeframe: 15 Min
📈 Setup Type: Supply Zone / Trend Continuation
🎯 Direction: SELL
⚙️ Confirmation: Bearish engulfing or rejection wick near zone
💬 “Trade what you see, not what you feel.”
Trade ideas
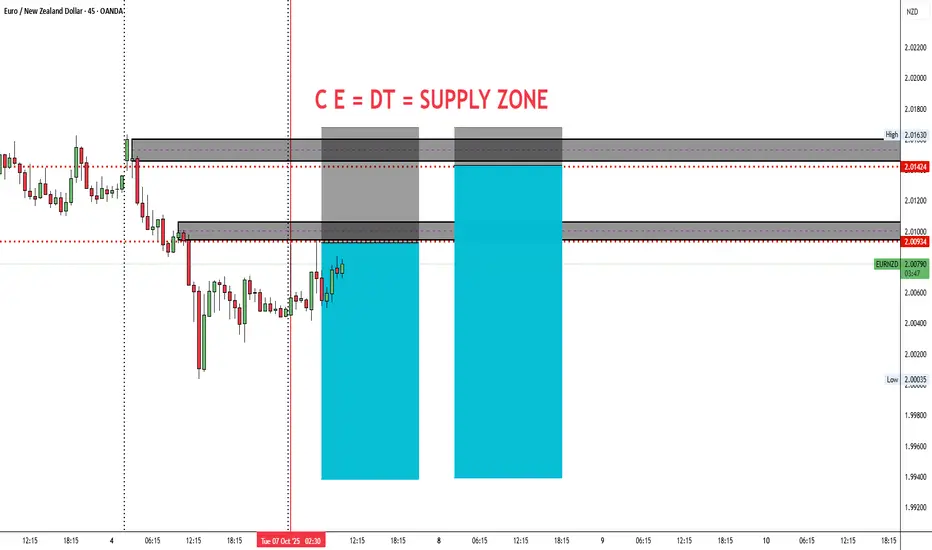
EURNZD SELL ENTRY - SUPPLY ZONE TRADE SETUP🔻 EURNZD SELL ENTRY - SUPPLY ZONE TRADE SETUP
📊 Timeframe: 45 Minutes
💡 Concept: CE = DT = Supply Zone
Price has reached the strong supply zone, where previous double top structure (DT) and change of character (CE) confirm potential bearish pressure.
Currently, price is testing the supply zone — expecting sellers to dominate from here.
📍 Entry Zone: 2.0093 – 2.0142
🎯 Target 1: 2.0000
🎯 Target 2: 1.9950
🛑 Stop Loss: Above 2.0163
🧠 Bias: Bearish
📈 Confirmation: Watch for rejection candles or lower timeframe structure break before entering short.
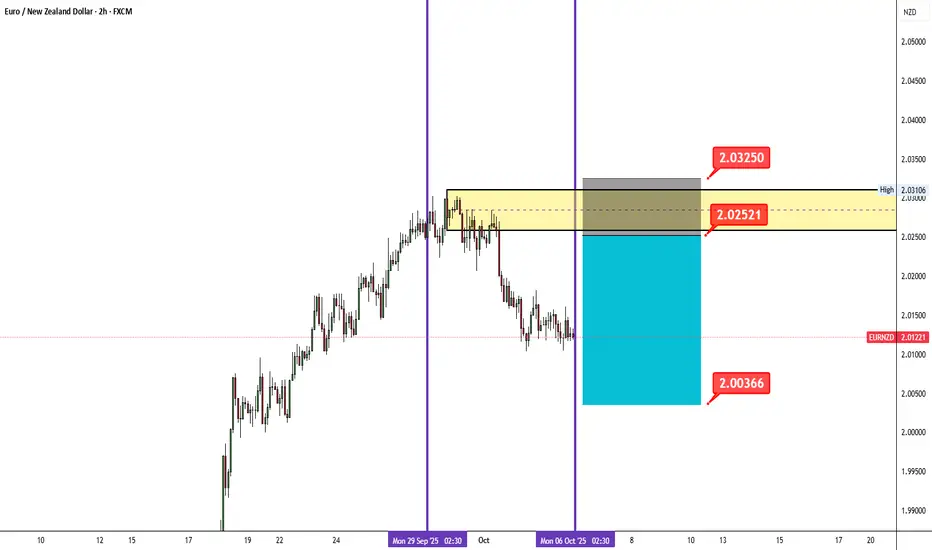
EURNZD – Bearish Setup (H2 Chart)📊 EURNZD – Bearish Setup (H2 Chart)
Pair: EURNZD
Timeframe: 2H
Bias: Short Position
🔎 Market Context:
Price recently rejected from the 2.02521 – 2.03250 resistance zone.
Sellers appear to be stepping in as bullish momentum weakens.
Structure points to a possible continuation lower if rejection holds.
📌 Trade Plan:
Entry Zone: 2.02521 – 2.03250
Stop Loss (SL): Above 2.03250
Take Profit (TP): 2.00366 (previous support / liquidity area)
⚖️ Risk-Reward (RR):
Approx 1:3, aligning with weekly trade management.
📅 Setup valid for Oct 6 – Oct 10, 2025
⚠️ Disclaimer: This chart idea is for educational purposes only, not financial advice. Always manage risk before trading.
EURNZDPrice action has been strongly bullish, with an impulsive push to the upside that took out a weekly high. That may have completed the price objective, which is why I’m now expecting a potential drop. A structure shift has already occurred and an entry was available, though I didn’t take it.
For now, I’ll stay on the sidelines and watch price action. If price reaches the demand zone, I’ll look for confirmation to get into longs. There’s also a large inefficiency/price void that could be filled on the way down. Let’s see how this pair develops — just sharing a possible scenario.

EURNZDEURNZD Market Outlook
The price on EURNZD has recently approached the 4H Supply Zone around the 1.96000 level and has flipped the short-term bearish structure, indicating potential bullish momentum. However, given the presence of supply, I'm monitoring the possibility of a retracement from this zone.
My primary scenario involves a short-term rejection from the 1.96000 Supply Zone, targeting a move down into the 1.94000 Demand Zone. From there, I will look for a sell-to-buy setup, with the intention of positioning for a larger upside continuation, provided bullish order flow confirms.
Alternatively, if buyers prove to be significantly strong and supply fails to hold, price may break through the 1.96000 zone and extend higher towards the daily wick area near the 1.98000 level.
Both scenarios remain valid depending on price action and volume behavior at key levels.
Will be watching 15min structure before entering any trade.

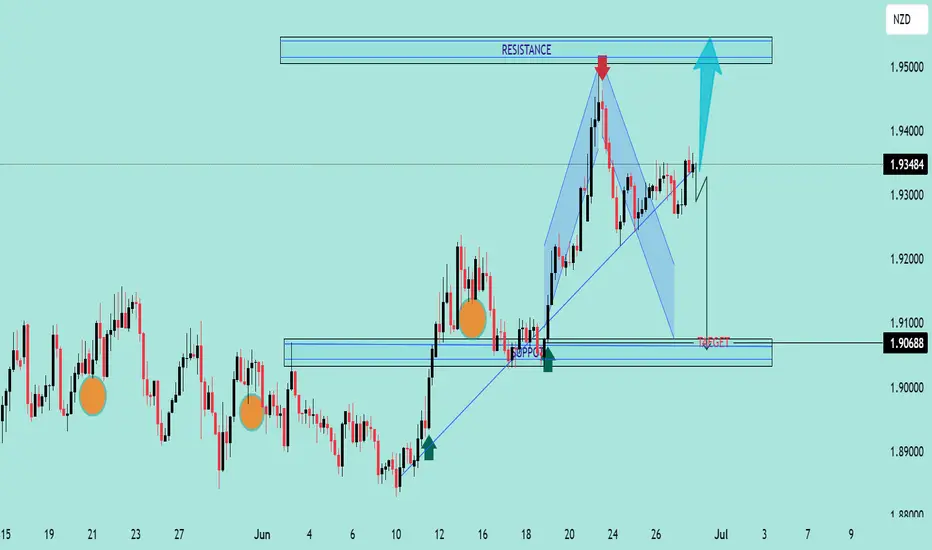
EURNZD Potential Breakout or Reversal? | Technical Analysis EURNZD Potential Breakout or Reversal? | Technical Analysis 🚀🔄
The chart illustrates a key technical setup on the EURNZD pair with both bullish and bearish possibilities depending on price action near critical zones.
🔍 Technical Highlights:
Bearish Harmonic Pattern Completed 📉
A harmonic structure has formed and completed near the resistance zone (~1.9500), triggering a bearish move towards the target at 1.90688.
Major Resistance Zone 🔺
Marked between 1.9450 - 1.9500, where previous price action showed strong rejection (highlighted by the red arrow). This remains the key zone to break for further upside.
Support & Breakout Zone 🟦
The price bounced off the support zone around 1.9068 - 1.9100, aligning with trendline support and a previous structure level. This zone also aligns with the target of the bearish harmonic move.
Trendline Retest & Bullish Continuation Possibility 🔼
The price broke above the bearish leg and is now consolidating. If price closes above 1.9350-1.9400, a potential breakout toward the 1.9500 resistance zone is expected (blue arrow).
🔄 Scenarios to Watch:
✅ Bullish Case:
Break and hold above 1.9400
Target: 1.9500 Resistance Zone
Confirmation: Strong bullish candles with volume above current range
❌ Bearish Case:
Rejection at current level (near 1.9350-1.9400)
Target: 1.9068, the harmonic completion target and support zone
Confirmation: Bearish engulfing/rejection candle with trendline break
📌 Conclusion:
EURNZD is at a crucial decision point. Watch closely for a breakout above or rejection from the current price range to determine whether the pair will retest highs or complete the bearish target move.
FXHUNTER / EURNZDFX:EURNZD Hello, I'm FXHUNTER. Welcome to my channel. In this post, we will examine the EURNZD symbol. According to the market structure, we have an important supply area, near which a liquidity area has formed, and it is likely that the price will hunt for liquidity and return from the supply area and continue its downward trend. Well, if you like the analysis, introduce us to your friends. Good luck.
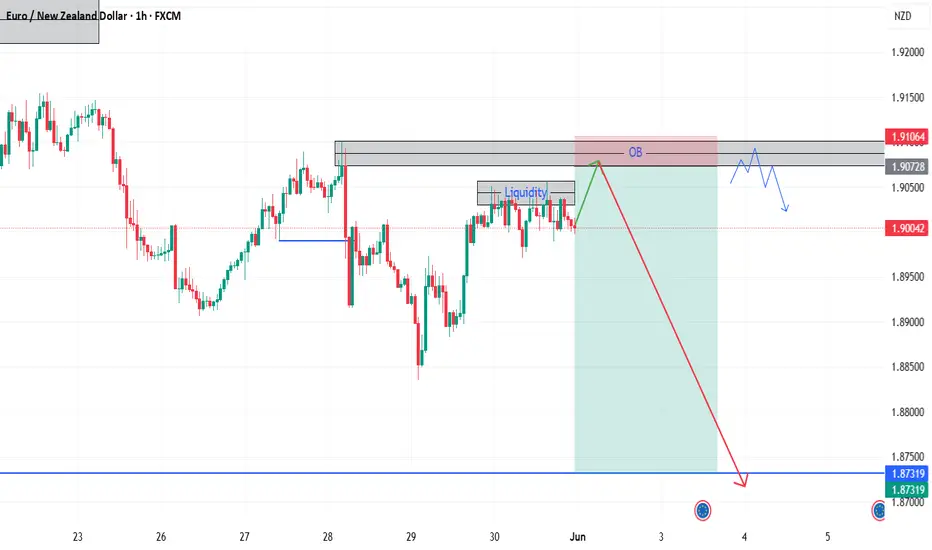
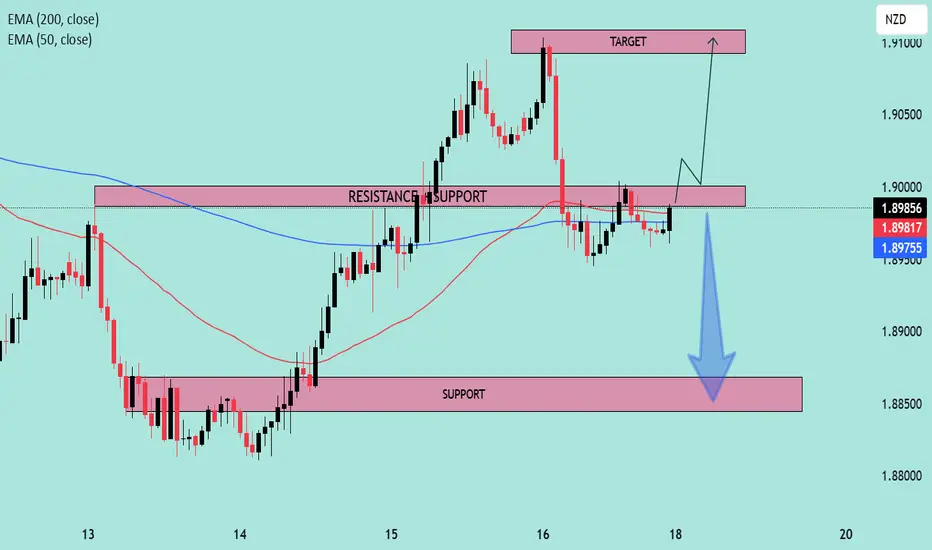
EURNZD at Key Decision Zone | Breakout or Breakdown? 📊 Pair: EURNZD
🕒 Timeframe: Likely H1 or H4
📅 Date: May 18, 2025
🔍 Technical Analysis
🔁 Key Zones
🔴 Resistance-Turned-Support (RTS):
1.8975 – 1.8990
This area was previously a resistance level that price broke above, and is now acting as a critical support zone (flip zone). Price is currently retesting this area.
🎯 Target Zone (Resistance):
1.9085 – 1.9110
This is the next projected bullish target if price successfully rebounds from current support.
🛑 Major Support Zone:
1.8840 – 1.8860
Strong buying interest was seen here previously, acting as a safety net in case of bearish rejection from the current level.
🔄 EMA Confluence
📘 EMA 200 (Blue): 1.8975
📕 EMA 50 (Red): 1.8981
Price is hovering around the EMAs, indicating a moment of decision. A decisive move above these EMAs could trigger bullish momentum. 📈
🔮 Scenario Outlook
🟢 Bullish Scenario (Preferred Setup)
✅ Confirmation above 1.8990
➡️ Retest and continuation could push price toward the 1.9100 target zone.
🔼 Momentum supported by prior breakout and higher lows.
📌 Entry Idea: Above 1.8995
🎯 Target: 1.9100
🛡️ Stop: Below 1.8950
🔴 Bearish Scenario
❌ If price fails to hold the 1.8970–1.8990 zone, a breakdown could follow.
⬇️ Likely move toward 1.8850 support zone.
🚨 Watch for bearish engulfing or rejection candles near resistance.
🧠 Summary
Price is at a key decision point.
✅ Bullish bias is slightly stronger due to market structure (higher highs & higher lows).
⚠️ But a clean break below support would shift focus to the downside.
📈 Strategy: Wait for confirmation ⚖️
Bullish: Break + retest of 1.8990
Bearish: Breakdown below 1.8950 and close under EMAs
EUR/NZD PAST TRADE SETUP BEFORE & AFTER📈 Technical Analysis:
Trendline Breakout:
Price action broke above a well-defined descending trendline (marked in green) on the 1H chart. This breakout indicated a shift from bearish to bullish momentum.
Bullish Structure Formation:
After the breakout, EUR/NZD formed higher highs and higher lows, confirming the beginning of a short-term uptrend.
Entry Zone:
I took a buy entry last Friday after the breakout and slight retest, aligning with a classic breakout-retest trading strategy.
Risk-Reward Setup:
The trade setup shows a strong risk-reward ratio, with the stop-loss positioned below the previous structure low (~1.89629) and a reasonable upside target in sight.
Volume Confirmation:
Increased volume during the breakout further validated the strength of the bullish move.
🌐 Fundamental Analysis:
Euro (EUR) Strength:
The Euro remained firm supported by stable inflation data and cautious but positive signals from the ECB, despite talks of potential future rate cuts.
New Zealand Dollar (NZD) Weakness:
New Zealand's economic data weakened (lower business confidence, soft retail sales).
Growing expectations that the RBNZ could cut rates sooner than expected weighed on the NZD.
Overall risk-off market sentiment last week also pressured the NZD, as investors moved toward safer assets.
Divergence in Central Bank Policies:
ECB's relatively more stable stance compared to RBNZ’s dovish outlook created a favorable condition for EUR/NZD buying opportunities.
Risk Sentiment:
With global geopolitical tensions and economic slowdown concerns, safe-haven buying of EUR over NZD further supported bullish momentum.

EUR/NZD Wave Structure Shift: 4th Wave Correction in ProgressThe 3rd wave in EUR/NZD appears to have been completed, and the market seems to be entering the 4th wave. There is a possibility that the 4th wave could take support near the Fibonacci 0.5 level (1.19164). After that, the 5th wave of the impulse phase may move upward.
If the market falls below 1.98303, it would confirm the beginning of the 4th wave. In that scenario, the first target could be around 1.95907 .

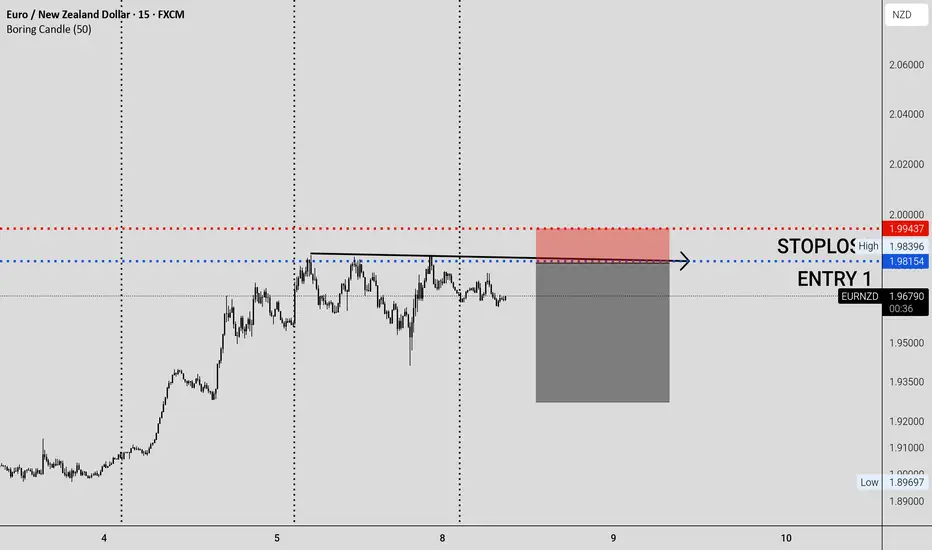
EURNZD sellEUR/NZD Short Trade Setup
Pair: EUR/NZD
Timeframe: 15M
Entry: 1.98154
Stop Loss: 1.99437
🔹 Market Structure: Price has been consolidating near resistance, forming a potential reversal zone.
🔹 Entry Confirmation: Break of key resistance level, looking for a rejection to enter short.
🔹 Stop Loss Placement: Above the previous high to manage risk.
📉 Trade Plan:
Waiting for price to react at the resistance zone before entering a short position. Targeting a move downward based on recent price action behavior.
🚨 Risk Disclaimer: This is not financial advice. Always use proper risk management and trade responsibly. I
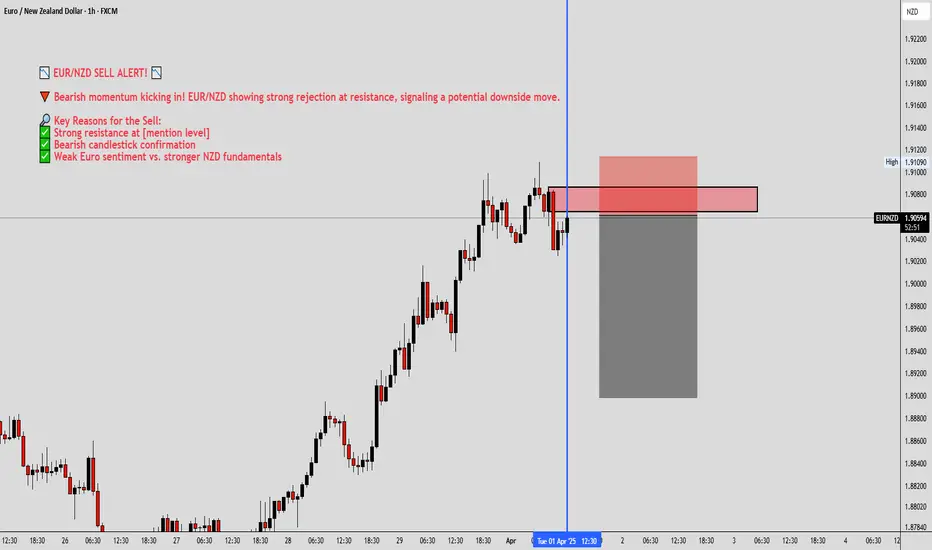
EURNZD SELL📉 EUR/NZD SELL ALERT! 📉
🔻 Bearish momentum kicking in! EUR/NZD showing strong rejection at resistance, signaling a potential downside move.
🔎 Key Reasons for the Sell:
✅ Strong resistance at
✅ Bearish candlestick confirmation
✅ Weak Euro sentiment vs. stronger NZD fundamentals
Sell Trade - EUR/NZDGreetings to everyone!
Place a sell trade on EUR/NZD and check out my chart for the ideal sell entry & stop-loss placement.
Remember :-
* Move your SL to breakeven once the trade reaches 1:1.5 R.
* Aim for a minimum reward of 1:2 R.
* Don't risk more than 2.5% of your total margin.
Let's execute this trade smartly! 🚀

Sell Trade - EUR/NZDGreetings to everyone!
Place a sell limit order on EUR/NZD and check out my chart for the ideal sell entry & stop-loss placement. If it gets executed so great and if not so that is fine too.
Remember (If this trade gets executed) :-
* Move your SL to breakeven once the trade reaches 1:1.5 R.
* Aim for a minimum reward of 1:2 R.
* Don't risk more than 2.5% of your total margin.
Let's execute this trade smartly! 🚀

EURNZDDisclaimer:- This is not A BUY OR SELL recommendation. please Consult with your financial advisor or with broker before taking any trade,
this post is for educational purpose only . warning :- do not jump directly or do not copy my trades
DO your analysis properly

EUR/NZD 4-Hour Chart AnalysisKey Observations:
1. Support Zone:
- The price is currently testing a key support zone around 1.82880–1.83160.
2. Uptrend Break:
- The ascending trendline has been broken, indicating a potential shift in momentum from bullish to neutral/bearish.
3. Trading Ranges:
- Resistance Above: Potential resistance is visible near 1.8450–1.8500, in case of a bullish recovery.
- Support Below: If the price breaks below the current support, the next levels to watch are:
- 1.8143 (intermediate support).
- 1.7986 (major support).
- 1.7806 (long-term support).
---
Trading Scenarios:
1. Bullish Continuation:
- If the price holds above 1.8315, a bounce toward the previous highs near **1.8450–1.8500** is possible.
- Entry: Above 1.8350.
- Targets: 1.8450, 1.8500.
- Stop-Loss: Below 1.8300.
2. Bearish Breakdown:
- If the price closes decisively below 1.8315, it could trigger further downside toward 1.8143 and possibly lower.
- Entry: Below 1.8300 (watch for retest).
- Targets: 1.8143, 1.7986, 1.7806.
- Stop-Loss: Above 1.8350.
---
- Be cautious of false breakouts and wait for confirmation (such as a strong candle close) before entering trades.
- Use proper risk management with defined stop-loss and target levels.
---
Disclaimer:
This analysis is for informational purposes only and does not constitute financial advice. Trading involves substantial risk, and past performance is not indicative of future results. Always conduct your own research and consult a financial advisor before making investment decisions. Trade responsibly.

EURNZD - OrderFlow The bullish trend is currently very strong on EUR/NZD. As long as the price remains above the support at 1.8050 NZD, you could try to benefit from the boom.

EURNZDLet's look at EurNzd for the next week. As you can see price made a nice push up and now naturally I would like to see the retracement back into the Demand zone. I will monitor the charts and check if I can get into any sell-to-buy setups - meaning selling before looking for buys into the Demand zone. ( that way I can position myself better ) Again what I need to see for my setup to become valid is a 15-minute structure flip/break. Nice setup overall.
Let's patiently wait and see what next week will show us.

EURNZD SHOWING HEAD AND SHOULDER PATTERN WITH 1:5 RISK REWARD EURNZD SHOWING A GOOD DOWN MOVE WITH 1:5 RISK REWARD
DUE TO THESE REASON
A. its following a rectangle pattern that stocked the market
which preventing the market to move any one direction now it trying to break the strong resistant lable
B. after the break of this rectangle it will boost the market potential for break
C. also its resisting from a strong neckline the neckline also got weeker ald the price is ready to break in the outer region
all of these reason are indicating the same thing its ready for breakout BREAKOUT trading are follws good risk reward
please dont use more than one percentage of your capitalfollow risk reward and tradeing rules
that will help you to to become a bettertrader
thank you

EURNZD BULLISH PUSH
The chart indicates a bullish breakout above resistance at 1.8137.
Price found strong support around the 1.75067 level.
Recent price action suggests buyers are currently in control of the market.
A retest of the breakout zone (red area) is likely before further movement.
The red zone represents a potential entry point for buyers after a pullback.
The blue shaded area above marks the next target zone for a continued upward move.
This move follows a period of consolidation near the lower support area.
Strong bullish momentum could indicate further uptrend continuation.
The price is reacting well to key support and resistance zones.
Traders may expect a bullish move unless price falls below the red zone during the retest.

LONG ENDaily live trade with EN in H1
This is my plan. My Strategy is Reversal or Pull Back method.
Win rate 65-70%.
R:R around 1:3
Trading is risky, so follow capital management and follow stoploss.

Eurnzd trade idea !! cup and handle pattern ?? #eurnzdEurnzd trade idea !! cup and handle pattern ?? #eurnzd
break out of resistance and retest + bearish enfulging candlestick
is enough to trade or we need to wait for more confirmation

TUESDAY CHARTS TALK ( going through all FX pairs )Hey, in this video I went through all of the FX pairs and shared my thoughts. Feel free to check it out!
Blessings, T
