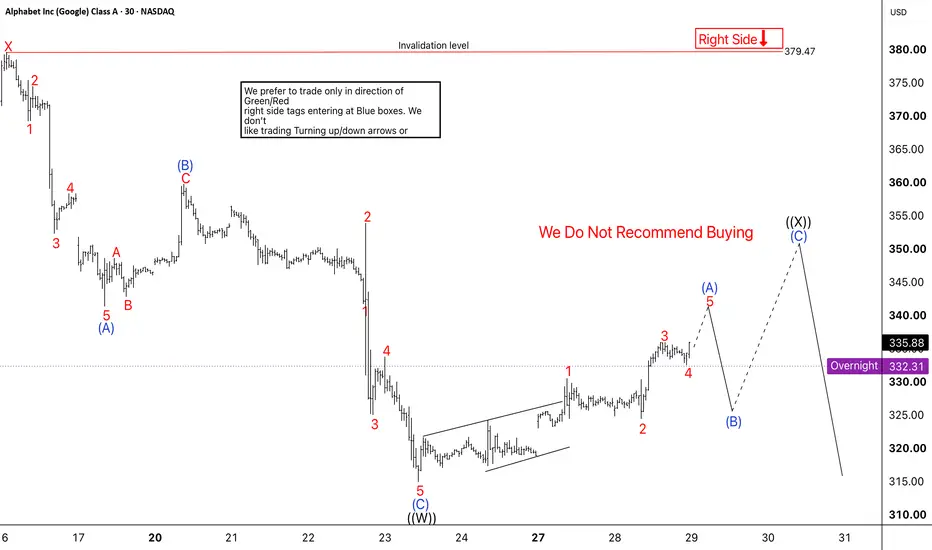
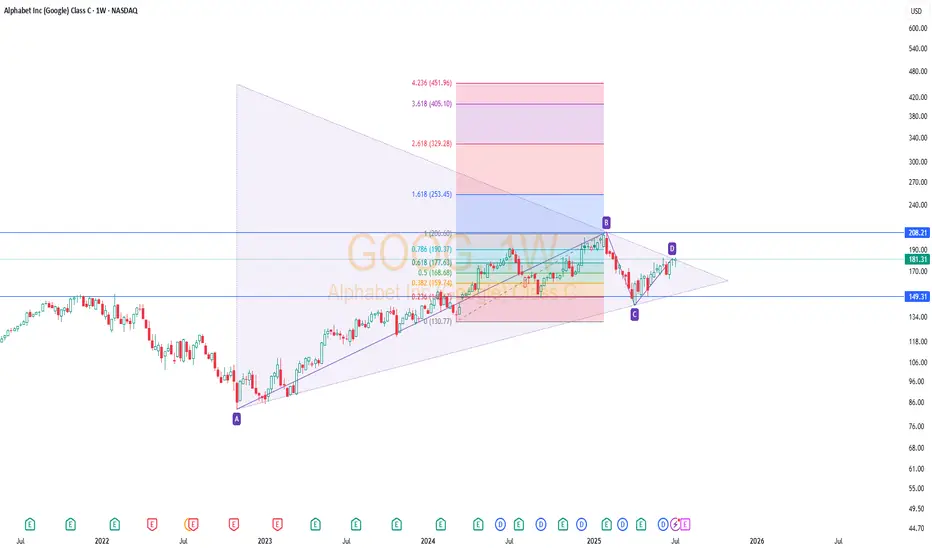
GOOGL Corrective Bounce Could Lead to Another Leg Lower Google (GOOGL) continues to trade within a corrective Elliott Wave structure after completing wave (C) of (W) near 312. The stock has since turned higher and appears to be developing a corrective recovery. The current structure suggests that GOOGL may continue higher in wave (A), with wave 5 still e
Alphabet Inc. Class C
No trades
No trades
Compare with Alphabet Inc. Class C
17.65 EUR
112.53 B EUR
343.09 B EUR
5.13 B
Last report date
Jul 22, 2026
Report period
Q2 2026
EPS
7.98 EUR
Revenue
104.89 B EUR
Earnings call summary
Revenue grew 24% year-over-year to $119.8B, driven by strong AI-led growth in Search, YouTube, and Cloud. Cloud revenue surged 82%, with backlog reaching $514B, and CapEx guidance was raised to support ongoing AI infrastructure investments.
Details
Sector
Industry
CEO
Sundar Pichai
Website
Headquarters
Mountain View
Founded
2015
IPO date
Aug 19, 2004
ISIN
US02079K1079
CUSIP
02079K107
FIGI
BBG00B4YYS70
Identifiers
ISIN US02079K1079
Alphabet, Inc. is a holding company, which engages in software, health care, transportation, and other technologies. It operates through the following segments: Google Services, Google Cloud, and Other Bets. The Google Services segment includes products and services, such as ads, Android, Chrome, devices, Google Maps, Google Play, Search, and YouTube. The Google Cloud segment refers to infrastructure and platform services, collaboration tools, and other services for enterprise customers. The Other Bets segment relates to the sale of healthcare-related services and internet services. The company was founded by Lawrence E. Page and Sergey Mikhaylovich Brin on October 2, 2015 and is headquartered in Mountain View, CA.
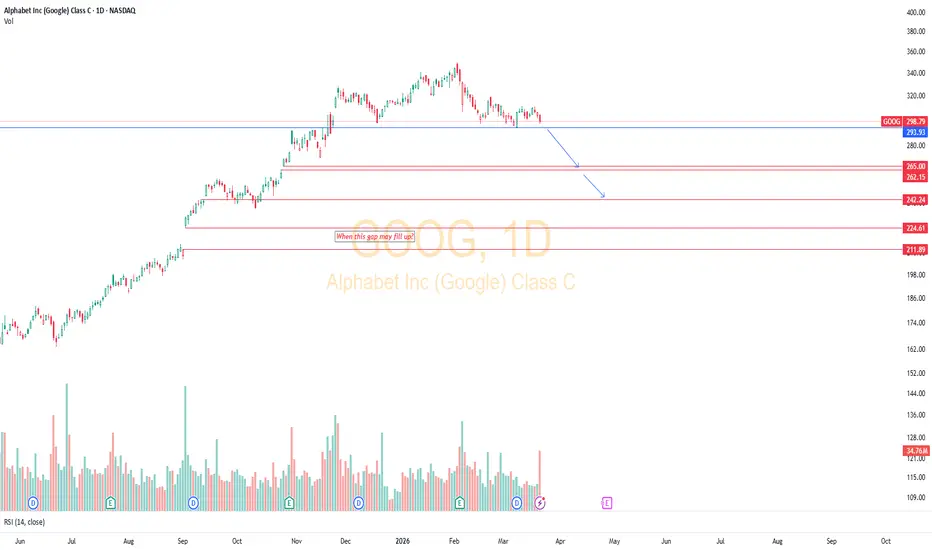
GooGSince 14th Apr 2025 there has been non-stop rally until Jan 2026. Only in Feb 2026 it has shown profit booking and the only reason for this selling is due to high disparity whicch has impacted means price reversal.
below 294 closing basis it may try to hit 271 and after the bounce the second fall ma
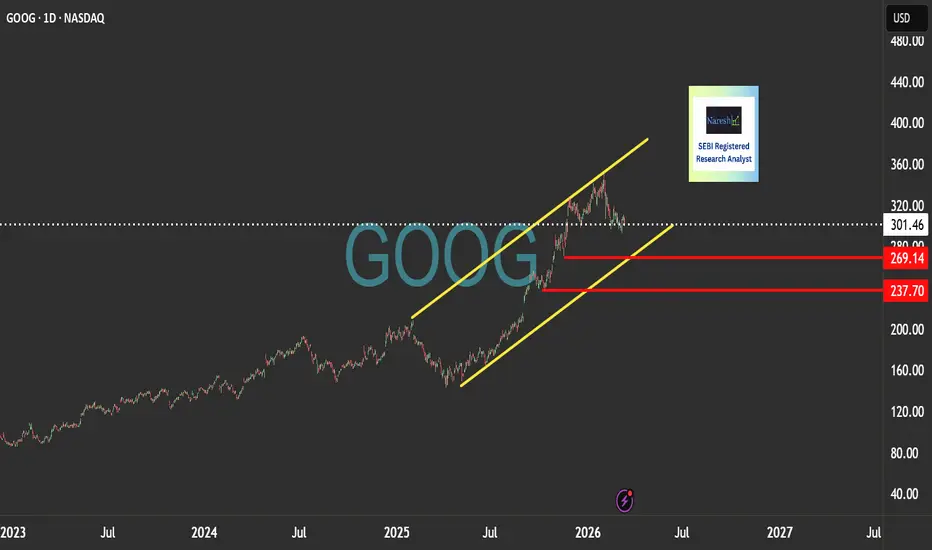
GOOGLE - War effect - Buy or Sell ?GOOGLE
LTP $ 301.46
💡 If you liked the idea, don’t forget to Boost 🚀
Your comments and views are always most welcome.
Aggressive Traders
Add on dips till 280
SL CLB 269
Expected Up moves 325/350 & Fresh ATH
Conservative Traders
Add on dips till 270
SL CLB 237
Expected Up moves 325/350 &
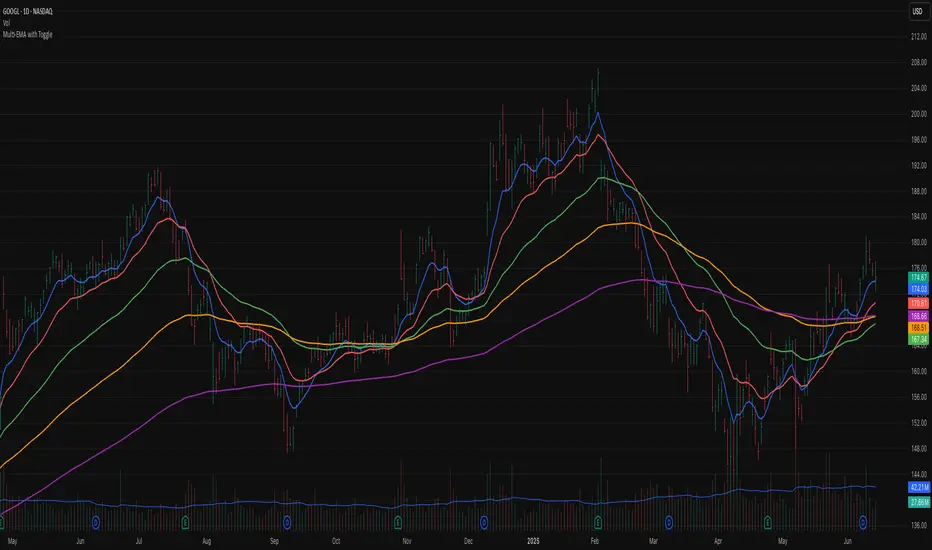
Multi-EMA Toggle Indicator A clean and versatile Exponential Moving Average (EMA) indicator featuring 5 fully customizable EMAs with individual toggle controls. Perfect for traders who want flexibility in their moving average analysis without cluttering their charts.
Key Features
✅ 5 Independent EMAs - Each with its own setti
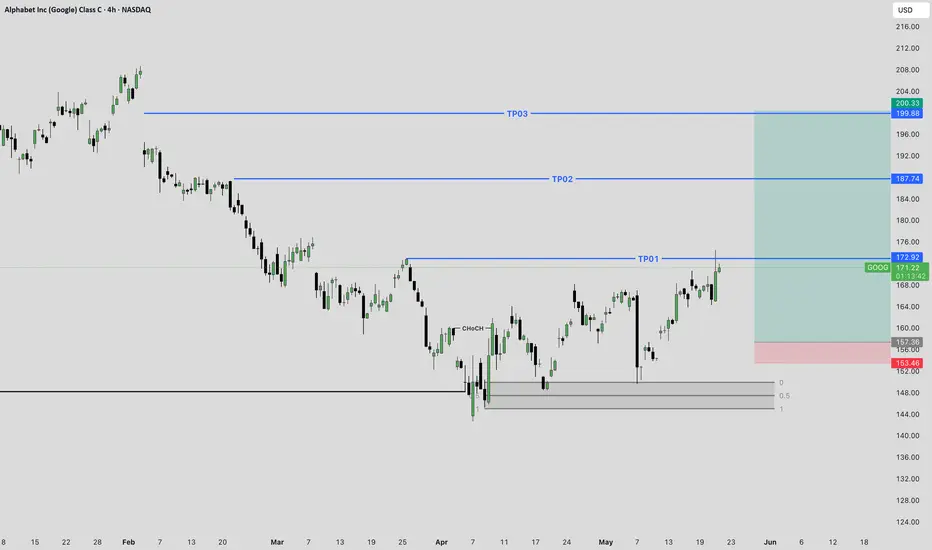
GOOG: Don't Miss This Potential Reversal!GOOG Long Idea
Chart Analysis:
The chart shows Alphabet Inc. (GOOG) on a 4-hour timeframe. After a period of decline from its highs, GOOG appears to be finding support around the "Weekly Liquidity" level. There's also a recent bullish impulse from this area, breaking above some minor resistance
Google: A compelling buy at the current priceHello,
As Warren Buffett famously said, "Be fearful when others are greedy, and greedy when others are fearful." This mindset is particularly relevant right now with Alphabet Inc.
Despite being a company whose products we use daily—and will likely rely on even more in the future—Alphabet's stock r
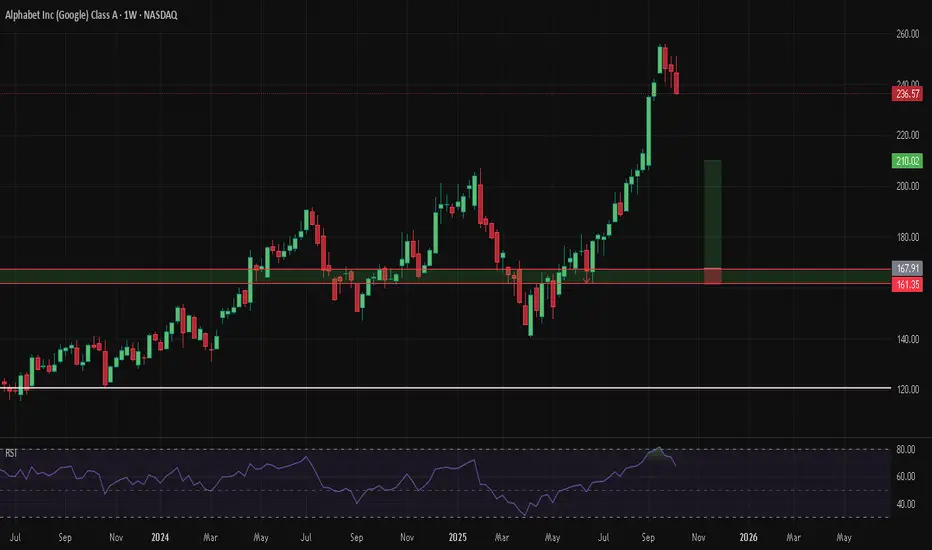
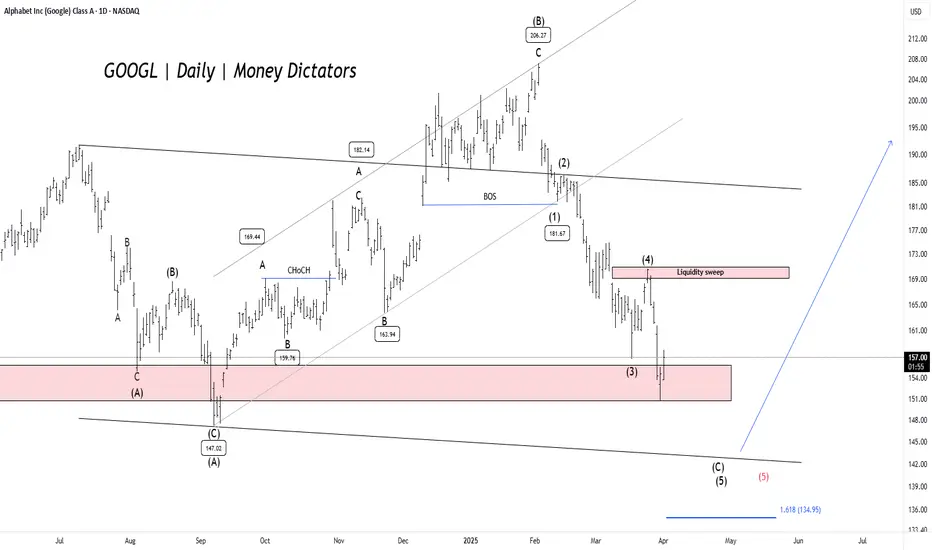
GOOGL - Elliott Wave Final ShowdownGOOGL has dropped over 27.28% , reaching a minor profit-booking zone. The $150 level serves as a key demand zone, where a potential price reversal could occur. The formation is either expanded flat or a running flat on the daily timeframe chart.
Confirmation is best observed near the lower trend
See all ideas
Summarizing what the indicators are suggesting.
Neutral
SellBuy
Strong sellStrong buy
Strong sellSellNeutralBuyStrong buy
Neutral
SellBuy
Strong sellStrong buy
Strong sellSellNeutralBuyStrong buy
Neutral
SellBuy
Strong sellStrong buy
Strong sellSellNeutralBuyStrong buy
An aggregate view of professional's ratings.
Neutral
SellBuy
Strong sellStrong buy
Strong sellSellNeutralBuyStrong buy
Neutral
SellBuy
Strong sellStrong buy
Strong sellSellNeutralBuyStrong buy
Neutral
SellBuy
Strong sellStrong buy
Strong sellSellNeutralBuyStrong buy
Displays a symbol's price movements over previous years to identify recurring trends.
Maturity dateFeb 13, 2126
Coupon6.13% (Fixed)
Maturity dateFeb 13, 2058
Coupon5.88% (Fixed)
Maturity dateNov 15, 2075
Coupon5.70% (Fixed)
Maturity dateFeb 15, 2066
Coupon5.75% (Fixed)
Maturity dateNov 15, 2055
Coupon5.45% (Fixed)
Maturity dateNov 13, 2041
Coupon5.50% (Fixed)
Maturity dateMay 15, 2065
Coupon5.30% (Fixed)
Maturity dateMay 15, 2055
Coupon5.25% (Fixed)
Maturity dateFeb 15, 2056
Coupon5.65% (Fixed)
Maturity dateFeb 15, 2046
Coupon5.50% (Fixed)
Maturity dateAug 15, 2050
Coupon2.05% (Fixed)
See all ABEC bonds
Frequently asked questions
The current price of ABEC is 288.60 EUR — it has increased by 0.12% in the past 24 hours. Watch Alphabet Inc. Class C stock price performance more closely on the chart.
Depending on the exchange, the stock ticker may vary. For instance, on FWB exchange Alphabet Inc. Class C stocks are traded under the ticker ABEC.
ABEC stock has fallen by −3.65% compared to the previous week, the month change is a −1.05% fall, over the last year Alphabet Inc. Class C has showed a 70.19% increase.
We've gathered analysts' opinions on Alphabet Inc. Class C future price: according to them, ABEC price has a max estimate of 479.88 EUR and a min estimate of 296.65 EUR. Watch ABEC chart and read a more detailed Alphabet Inc. Class C stock forecast: see what analysts think of Alphabet Inc. Class C and suggest that you do with its stocks.
ABEC reached its all-time high on May 18, 2026 with the price of 344.15 EUR, and its all-time low was 28.00 EUR and was reached on Oct 8, 2015. View more price dynamics on ABEC chart.
See other stocks reaching their highest and lowest prices.
ABEC stock is 1.86% volatile and has beta coefficient of 0.37. Track Alphabet Inc. Class C stock price on the chart and check out the list of the most volatile stocks — is Alphabet Inc. Class C there?
Today Alphabet Inc. Class C has the market capitalization of 3.58 T, it has decreased by −2.00% over the last week.
Yes, you can track Alphabet Inc. Class C financials in yearly and quarterly reports right on TradingView.
Alphabet Inc. Class C is going to release the next earnings report on Oct 27, 2026. Keep track of upcoming events with our Earnings Calendar.
ABEC earnings for the last quarter are 7.98 EUR per share, whereas the estimation was 2.52 EUR resulting in a 216.66% surprise. The estimated earnings for the next quarter are 2.63 EUR per share. See more details about Alphabet Inc. Class C earnings.
Alphabet Inc. Class C revenue for the last quarter amounts to 104.89 B EUR, despite the estimated figure of 101.94 B EUR. In the next quarter, revenue is expected to reach 110.20 B EUR.
ABEC net income for the last quarter is 98.24 B EUR, while the quarter before that showed 54.16 B EUR of net income which accounts for 0.00% change. Track more Alphabet Inc. Class C financial stats to get the full picture.
Yes, ABEC dividends are paid quarterly. The last dividend per share was 0.19 EUR. As of today, Dividend Yield (TTM)% is 0.25%. Tracking Alphabet Inc. Class C dividends might help you take more informed decisions.
Alphabet Inc. Class C dividend yield was 0.26% in 2025, and payout ratio reached 7.68%. The year before the numbers were 0.32% and 7.46% correspondingly. See high-dividend stocks and find more opportunities for your portfolio.
As of Jul 30, 2026, the company has 190.82 K employees. See our rating of the largest employees — is Alphabet Inc. Class C on this list?
EBITDA measures a company's operating performance, its growth signifies an improvement in the efficiency of a company. Alphabet Inc. Class C EBITDA is 155.30 B EUR, and current EBITDA margin is 38.17%. See more stats in Alphabet Inc. Class C financial statements.
Like other stocks, ABEC shares are traded on stock exchanges, e.g. Nasdaq, Nyse, Euronext, and the easiest way to buy them is through an online stock broker. To do this, you need to open an account and follow a broker's procedures, then start trading. You can trade Alphabet Inc. Class C stock right from TradingView charts — choose your broker and connect to your account.
Investing in stocks requires a comprehensive research: you should carefully study all the available data, e.g. company's financials, related news, and its technical analysis. So Alphabet Inc. Class C technincal analysis shows the sell today, and its 1 week rating is buy. Since market conditions are prone to changes, it's worth looking a bit further into the future — according to the 1 month rating Alphabet Inc. Class C stock shows the buy signal. See more of Alphabet Inc. Class C technicals for a more comprehensive analysis.