INFOSYS MY TECHNICAL VIEWS 19-11-25After retest of support, multiple times, price ready to go up.
Nifty It and Infosys charts are almost identical..
Nifty is already in trend. VIX Normal. dollar index below 100. Good delivery. Everything look perfect. Anything missing?
Your views and suggestion are invited.
Next report date
—
Report period
—
EPS estimate
—
Revenue estimate
—
0.65 EUR
2.92 B EUR
17.82 B EUR
4.15 B
About Infosys Limited
Sector
Industry
CEO
Salil S. Parekh
Website
Headquarters
Bangalore
Founded
1981
ISIN
US4567881085
FIGI
BBG000JZ29B7
Infosys Ltd. is a digital services and consulting company, which engages in the provision of end-to-end business solutions. It operates through the following segments: Financial Services, Retail, Communication; Energy, Utilities, Resources, and Services; Manufacturing, Hi-Tech, Life Sciences, and All Other. The company was founded by Dinesh Krishnan Swamy, Senapathy Gopalakrishnan, Narayana Ramarao Nagavara Murthy, Raghavan N. S., Ashok Arora, Nandan M. Nilekani, and S. D. Shibulal on July 2, 1981 and is headquartered in Bangalore, India.
Related stocks

Earnings Season Trading1. What Makes Earnings Season Important?
Earnings reports reveal the true financial health of a company. This data often contradicts or validates market expectations built over the previous quarter. When results surprise on the upside or downside, stocks can react with sudden gaps, breakouts, or re

Introduction to Put-Call Ratio (PCR)Psychology in Option Trading
Option trading is not just technical—it's emotional.
Traders face:
Fear of missing out (FOMO)
Overtrading during high volatility
Holding losers too long
Expecting miracles from OTM options
Disciplined psychological control is essential.

Trade Best With These Premium Charts PatternsChart patterns form the visual language of financial markets. They compress the psychology of buyers and sellers into a structure that traders can read, interpret, and act upon. Among the numerous patterns that appear on charts, a special set falls into the category of premium chart patterns—high-pr

Higher low formationInfosys took support of the Fib level 0.618 at 1490 and is moving upwards. 1560 becomes an immediate resistance

Technical Indicators Used in Momentum Trading1. Relative Strength Index (RSI)
The Relative Strength Index (RSI) is one of the most popular momentum indicators used by traders. Developed by J. Welles Wilder, the RSI measures the speed and magnitude of price movements over a specified period, typically 14 days. The indicator oscillates between
Part 3 Learn Institutional Trading 1. Option Buying Risks
High time decay
Entire premium can be lost
Low probability of profit if market does not move fast
2. Option Selling Risks
Unlimited loss potential
Requires high margin
Needs strong risk management skills
3. Volatility Risk
Changes in implied volatility affect premium

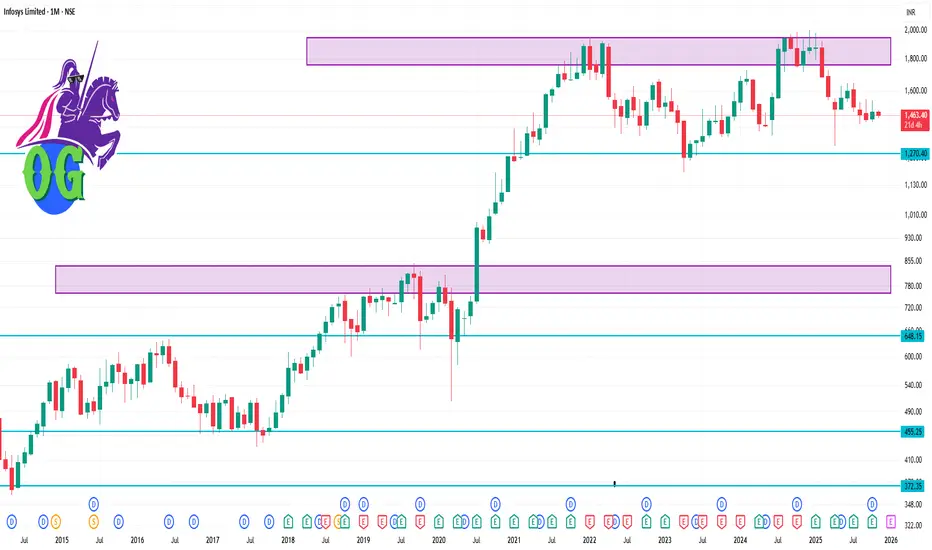
INFY 1 Week Time Frame 🎯 Key Levels
Based on recent chart and analysis sources:
Support zone around ₹ 1,440 – ₹ 1,420.
Resistance zone near ₹ 1,530 – ₹ 1,550.
52-week high ~ ₹ 2,006 and low ~ ₹ 1,307.

INFY 1 Month Time Frame 📊 Current status
Latest quoted price is around ₹1,466.70.
Technical indicators (daily & monthly) show a bearish bias. On daily, moving averages all give “Sell”.
From chart commentary: Intermediate resistance visible at ~ ₹1,479–₹1,523. Support stated around ~ ₹1,425–₹1,385, and a stronger support
Understanding How Options Work: Calls and Puts Simplified1. What Are Options?
An option is a type of financial contract that gives the buyer the right, but not the obligation, to buy or sell an underlying asset (like a stock, index, or commodity) at a predetermined price (called the strike price) before or on a specific date (called the expiration date).
See all ideas
An aggregate view of professional's ratings.
Neutral
SellBuy
Strong sellStrong buy
Strong sellSellNeutralBuyStrong buy
Neutral
SellBuy
Strong sellStrong buy
Strong sellSellNeutralBuyStrong buy
Neutral
SellBuy
Strong sellStrong buy
Strong sellSellNeutralBuyStrong buy
Displays a symbol's price movements over previous years to identify recurring trends.
Curated watchlists where IOY is featured.

Indian stocks: Racing ahead
46 No. of Symbols
See all sparks