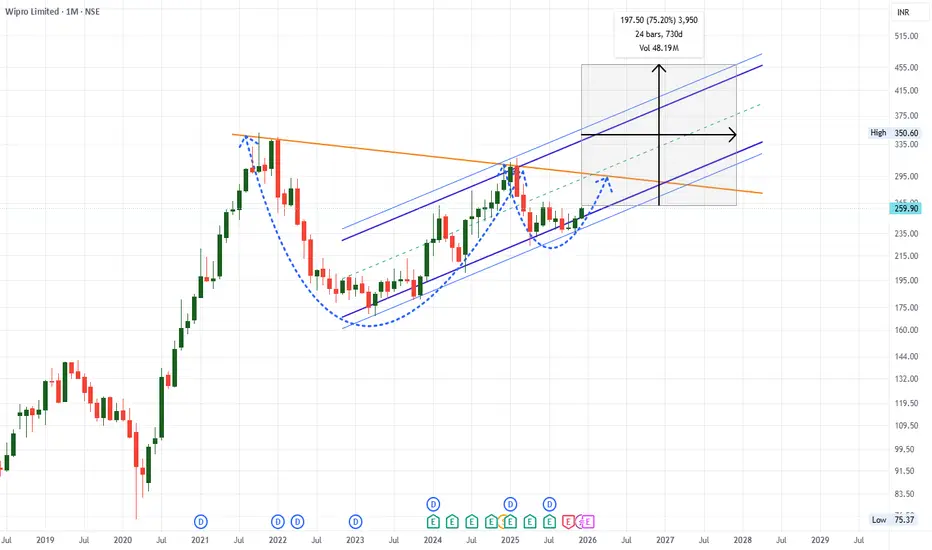
WIPRO Targets 460+ in next 2 Years Possibility.WIPRO Targets 460+ in next 2 Years Possibility.
WIPRO's Weekly Chart suggest Bottom formation near 236 Levels & now we see very limited downside on the stock.
LTP - 260
Targets - 460+
No SL at it is long term Investment stock.
Timeframe - 24-30 Months.
Happy Investing.
Next report date
—
Report period
—
EPS estimate
—
Revenue estimate
—
0.12 EUR
1.44 B EUR
9.74 B EUR
10.47 B
About Wipro Limited
Sector
Industry
CEO
Srinivas Pallia
Website
Headquarters
Bengaluru
Founded
1945
ISIN
US97651M1099
FIGI
BBG000MM5WD6
Wipro Ltd. is a global information technology, consulting and outsourcing company, which engages in the development and integration of solutions. It operates through the following segments: Information Technology Services, India State Run Enterprise Services, and Information Technology Products. The Information Technology Services segment provides digital strategy advisory, customer-centric design, technology consulting, IT consulting, custom application design, development, re-engineering and maintenance, systems integration, package implementation, global infrastructure services, analytics services, business process services, research and development, and hardware and software design to enterprises worldwide. The Information Technology Products segment offers a range of third-party IT products. The company was founded on December 29, 1945 and is headquartered in Bengaluru, India.
Related stocks
WIPRO 1 Day Time Frame 📊 Quick Snapshot
Last traded price: ~ ₹255-256
52-week range: Low ~ ₹228, High ~ ₹324–325
Recent volatility: stock has been trading in a range near ₹250–256 over past few sessions.
📈 What to Watch for the Day
If price holds above ~₹255 and gains strength, Wipro may attempt a move toward ₹265-
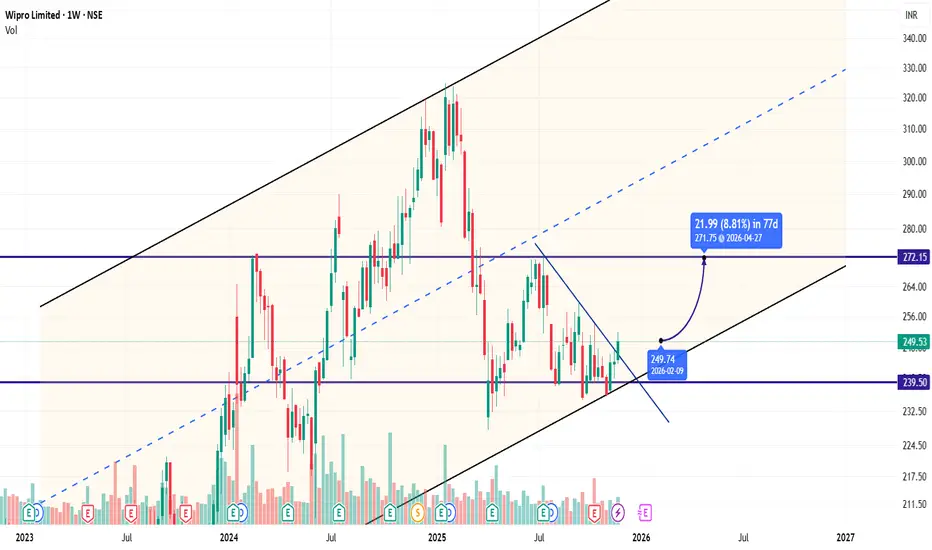
WIPRO TARGET 272 STOPLOSS 235Wipro already 34% low from the previous all time high. Good reversed back from the 52weeks low and previous three weeks bullish closing above each week high. Breakout from the low trend line resistance in weekly. Long term target 320. Short term target is 270
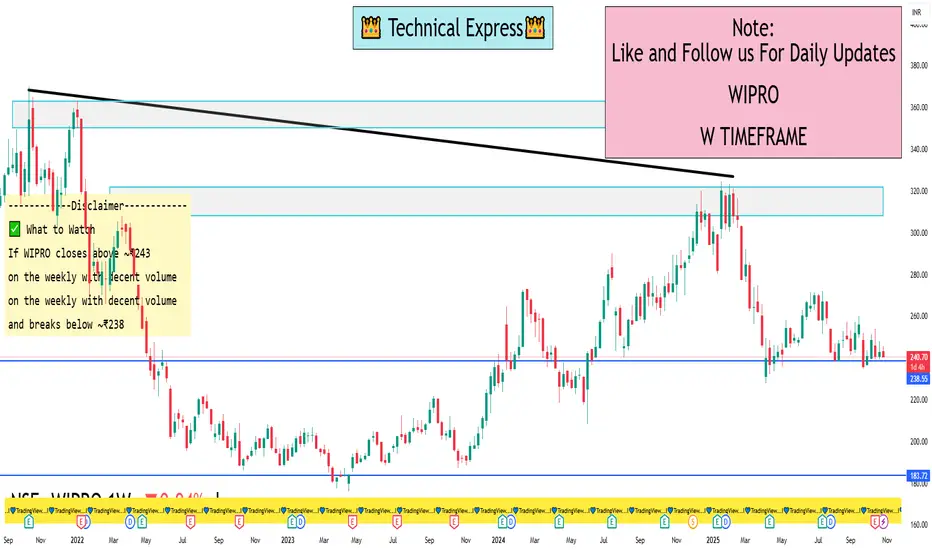
WIPRO 1 Week Time Frame🔍 Key levels
Current price (approx): ₹ 236.49.
Recent weekly low zone / support: around ₹ 235–238. (Recent lows noted ~₹ 236.00)
Near-term resistance / recent highs: around ₹ 243–245.
Technical sentiment: The 1-week technical rating from one source shows a “Sell” bias.
🎯 Implication for the nex
The Gann Fan is a powerful technical analysis tool (WIPRO)The Gann Fan is a powerful technical analysis tool created by W.D. Gann that combines price + time + geometry to identify support, resistance, and potential reversal points.
Your Wipro chart already has a perfectly drawn Gann Fan — let’s decode exactly how to use it step-by-step for real trading.
1.

WIPRO 1 Week View📊 Current Price & Context
The last closing price is around ₹242.98.
The stock has a 52-week range of ~ ₹228.00 (low) to ~ ₹324.60 (high).
Weekly pivot/structure is showing neutral-to-bearish trend unless a strong breakout occurs.
🔍 Weekly Frame Key Levels
Based on multiple technical sources:
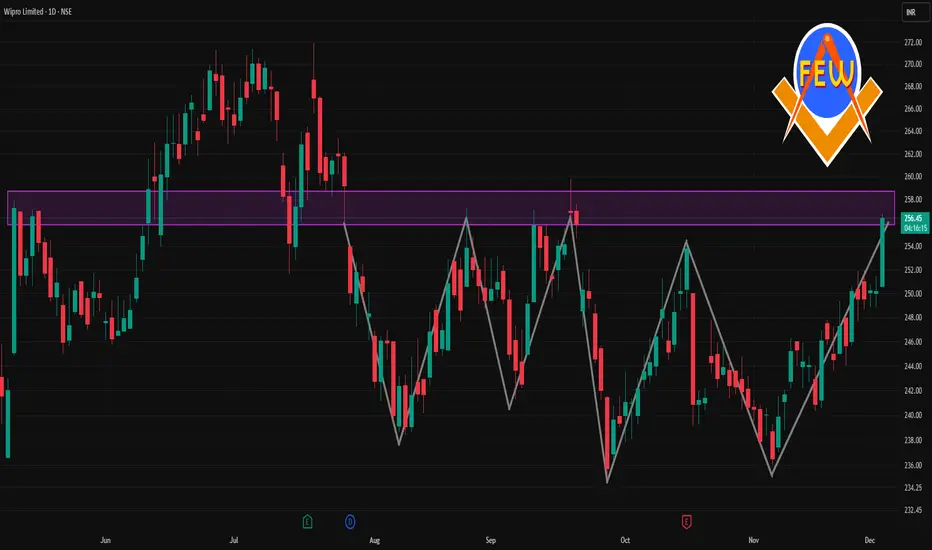
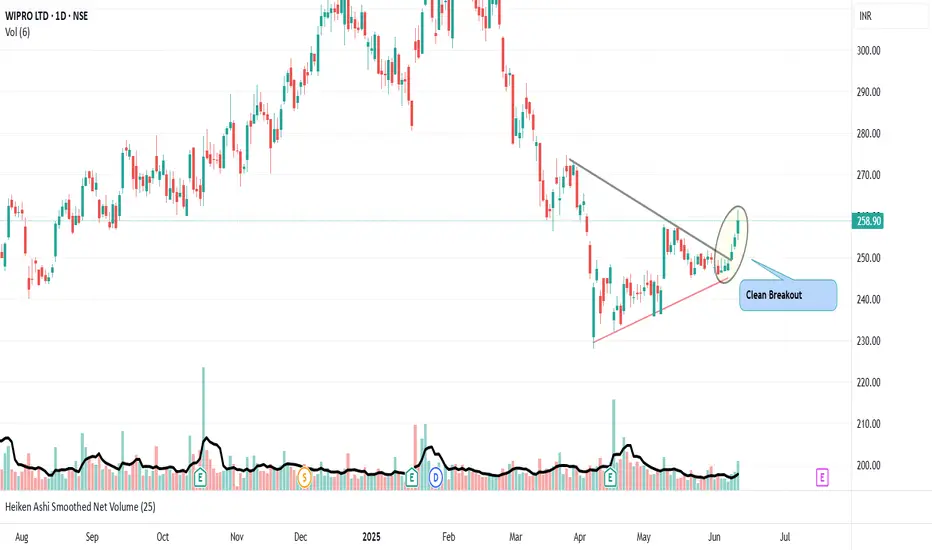
Wipro clean breakoutWipro 258 has given a clean breakout. Target 278
Volume increase with Price shows strength.
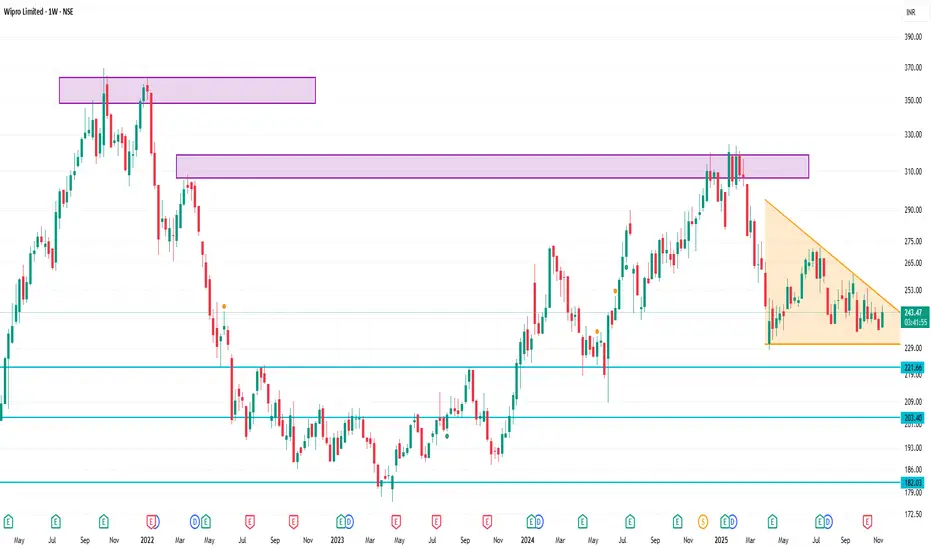
WIPRO Bullish Pattern - Falling Wedge - Short TermWipro is gearing up for a bullish movement if it can break the upper trendline. Probably will be a pull back to below trendline before triggering the breakout.

View On Wipro (Bullish For Next 6 Months)## Wipro Limited
breakdown of Wipro’s business model — **how it creates value**, **how it delivers it**, and **how it earns money** — along with some of the strategic shifts it’s making.
---
### 1. What Wipro does & value proposition
* Wipro offers **IT services**, **consulting**, **engineerin

Wipro Wipro Now Bearish Pattern ABCD.. So follow this pattern right now, Pattern cnfm B Bellow Close
Stoploss C Above close.
Bullish pattern cnfm Butterfly pattern B (258) break above only

See all ideas
An aggregate view of professional's ratings.
Neutral
SellBuy
Strong sellStrong buy
Strong sellSellNeutralBuyStrong buy
Neutral
SellBuy
Strong sellStrong buy
Strong sellSellNeutralBuyStrong buy
Neutral
SellBuy
Strong sellStrong buy
Strong sellSellNeutralBuyStrong buy
Displays a symbol's price movements over previous years to identify recurring trends.
Curated watchlists where WIOA is featured.

Indian stocks: Racing ahead
46 No. of Symbols
See all sparks