BUY AUDJPY• Trend direction :-After breaking the trend line and retesting the support zone again, I will buy
• Buy zone:-------- 108.976
• Stop loss--------- 108.428
• Target levels---- 111.008
• Risk management plan 📊
JAPANESE YEN / AUSTRALIAN DOLLAR
No trades
What traders are saying

AUDJPY Hourly 1:4 RRAs AUDJPY is in Uptrend
my idea to trade is mentioned in Chart
entry point OB rest at equilibrium of Dealing range
i will only enter after conformation of lower time frame (Upside Choch) in either one or five minutes
if it played well will get 1:4 RR Trade
#Forex #AUDJPY #FXtrade

Trade AUDJPY with Precision – Real-Time Insights Await!Never miss a AUDJPY opportunity again. Get live quotes, advanced charting tools, and instant trade execution—all in one platform. Perfect for traders who act on precision.

AUDJPY : Bulls Defending the Line 106.60 !AUDJPY has undergone a significant correction, sliding from the 109.00 peak down to the 106.20 region. However, the bears have hit a massive roadblock. We are currently seeing a strong reaction from a historical demand zone (105.80 – 106.00), marked by the clear rejections in the shaded circles on the chart.
🔍 The Critical Battleground: 106.00 – 106.60
The price is currently hovering around 106.57. This "buffer zone" between current levels and the demand floor is make-or-break for the next major move.
🚀 The Bullish Scenario (Hold & Bounce)
If buyers can maintain support above 106.60 and consolidate north of the demand zone, we have a clear path for a recovery.
Target: 🎯 108.15
Rationale: Sustained trading above 106.60 confirms that the historical demand is holding and the correction is over.
One more chance is price slides down till 106 and then bounce back above 106.50 which transforms into re-entry.
⚠️ The Bearish Scenario (Break & Flush)
If the bulls lose their grip and the price slides back through the floor, I’ll be switching my bias.
Trigger: A clean break below 105.85.
Target: 🎯 104.80
Rationale: Once 105.80 fails, the historical support flips to resistance, opening the trapdoor for a deeper sell-off.
💡 Summary: I am watching the 106.60 level closely. As long as we stay above it, the outlook remains cautiously optimistic for a move back toward 108+.

AUDJPYExpecting this scenario on AJ as after weekly supply was tapped price reacted bearish. Will be monitoring for possible shorts.

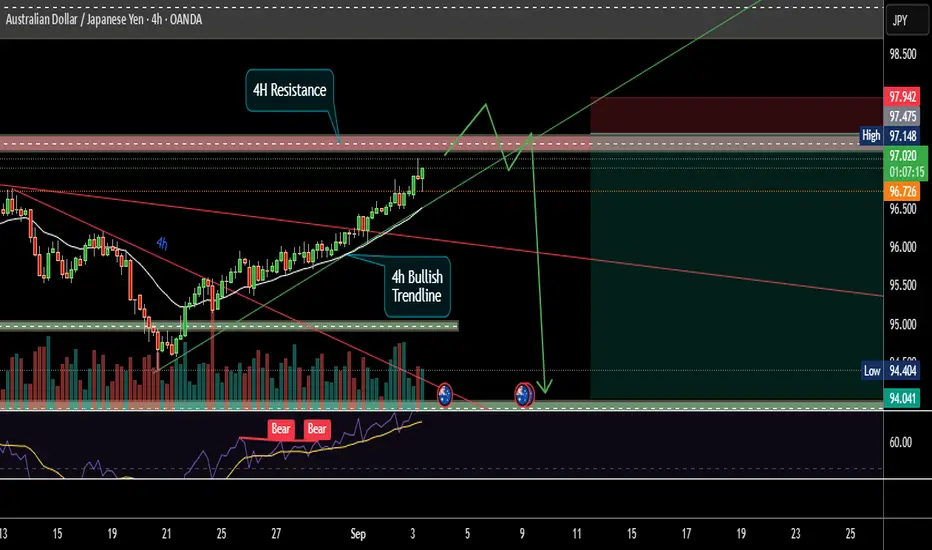
AUDJPY SHORTSAUDJPY – Short Setup Idea
Bulls are clearly showing weakness — just look at the 4H chart on the right. The climb has been slow and corrective, suggesting a lack of strong momentum to the upside.
Price has recently reached into a 4H supply zone. At first glance, it looked as though the zone was invalidated, but on closer analysis, the move primarily mitigated a past price void/imbalance. For that reason, I still consider the short setup valid.
I am looking for a potential swing opportunity to the downside. My stop-loss is placed above the most recent significant 15-minute high, as a break of that level would invalidate the idea and I would no longer want to be in the trade.
15min Flip did happen.
This setup offers favorable risk-to-reward potential if price respects the supply zone and continues lower.

AUD/JPY 4H chartAUD/JPY 4H chart:
The price was in an upward channel, then broke down sharply below both the Ichimoku cloud and the support trendline.
There’s a clearly marked resistance zone around 100.2–100.6, which the price rejected strongly.
The chart shows a target line drawn downward from the breakout area.
Based on the image, the target point appears to be around the 97.80–98.00 zone.
🔍 Summary:
Resistance: 100.2–100.6
Current price: ≈ 99.21
Bearish breakdown target: 97.8–98.0
Bias: Bearish continuation while below 99.6

AUDJPY – High-Probability Sell Zone IdentifiedAUDJPY – High-Probability Sell Zone Identified
After a strong bullish correction, price has entered a major resistance zone where previous supply caused a strong sell-off. Market structure shows signs of exhaustion — ideal for a short setup.
📉 Trade Setup Details:
Pair: AUDJPY
Timeframe: 3H
Direction: Sell
Entry: 99.921
Stoploss: 100.649
Target: 97.780
💡 Analysis:
Price retested previous supply zone near 100.00 psychological level.
Strong bearish rejection expected at this level.
Potential move back to lower demand area around 97.70 zone.
⚙️ Risk-Reward: 1:3
📍 Strategy: Retest + Supply Zone Rejection
🔥 Discipline: Follow the plan — Wait for confirmation candle before execution.

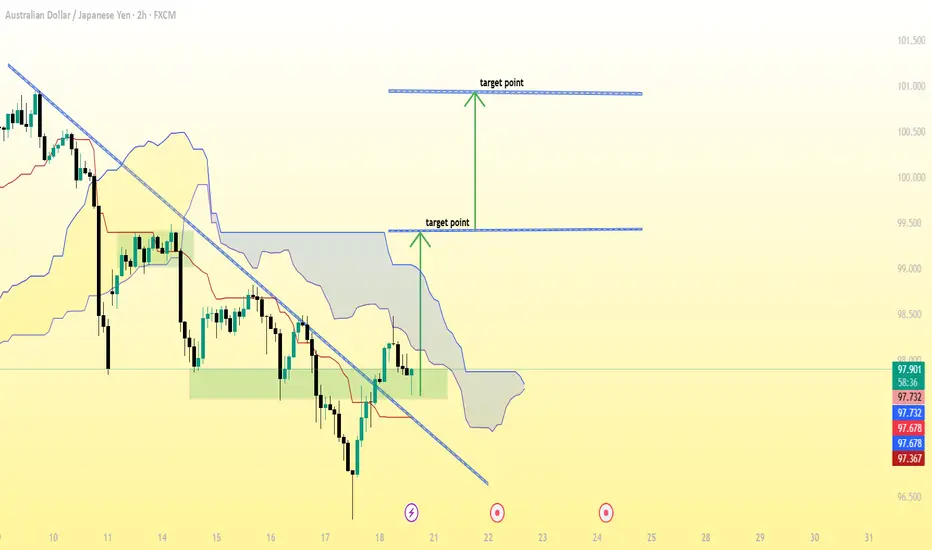
AUD/JPY (2-hour timeframe), here’s a breakdown of what’s visibleAUD/JPY (2-hour timeframe), here’s a breakdown of what’s visible:
The downtrend line has been broken to the upside, suggesting a potential bullish reversal.
The Ichimoku Cloud shows price moving above or attempting to move above the cloud — another bullish signal.
Two target points are already marked on my chart:
1. First target: around 99.50
2. Second (final) target: around 100.75–101.00
✅ Summary of Target Zones:
🎯 Target 1: ~99.50
🎯 Target 2: ~100.75–101.00
📉 Stop Loss Suggestion:
My might place it just below the recent support or below the cloud (around 97.00–97.20 zone), depending on my risk tolerance.
AUDJPY Sell SetupPrice is retesting the supply zone between 98.20 – 98.45 after a strong bearish fall.
Expecting rejection to push price back toward 96.30 – 96.20 zone.
🎯 Entry: 98.20 – 98.40
🛑 SL: 98.50
✅ TP: 96.30
⚖️ High RR setup | Follow the structure | Patience = Profit

AUDJPY – SELL SETUP (2H TIMEFRAME)AUDJPY – SELL SETUP (2H TIMEFRAME)
📉 Bias: Bearish Rejection Zone Formed
Price made a strong downside move after a sharp drop and is now pulling back into a major supply zone (100.370 – 100.992).
This area aligns with previous structure highs and imbalance, making it a high-probability reversal zone.
📍 Entry: 100.370
🛑 Stop Loss: 100.992
🎯 Target 3: 97.891
Market Structure:
Clear break of previous demand zone
Retest of strong supply area
Bearish continuation expected if price rejects this zone
Risk–Reward Ratio: Excellent (1:4+)
Confirmation: Watch for bearish rejections or reversal candlesticks near entry zone
---
📊 Plan the trade. Trade the pl i

SELL ENTRY - AUDJPY🔻 SELL ENTRY - AUDJPY 🔻
Price has tapped into a premium supply zone on the 15-min timeframe after a strong bullish push.
Now expecting rejection and possible continuation to the downside.
📊 Timeframe: 15 Min
📈 Setup Type: Supply Zone / Lower High Formation
🎯 Direction: SELL
⚙️ Confirmation: Bearish candle formation or liquidity sweep
💬 “Patience before precision. Wait for confirmation before execution.”

AUDJPY – Bearish Supply Zone Setup (H1 Chart)📊 AUDJPY – Bearish Supply Zone Setup (H1 Chart)
Pair: AUDJPY
Timeframe: 1H
Setup Type: Supply Zone (Rally-Base-Drop)
🔎 Market Context:
AUDJPY has been showing bearish momentum after rejecting higher levels.
Price is currently consolidating and attempting a retest of a strong supply zone (97.794 – 98.160).
The yellow zone represents the last base of supply where sellers previously stepped in.
📌 Trade Plan:
Entry Zone: 97.794 – 98.160
Stop Loss (SL): Above 98.160 (protected zone)
Take Profit (TP): 96.844 (previous demand & liquidity area)
⚖️ Risk-Reward (RR):
Approx 1:3, making this a high-probability setup.
🧠 Trade Idea Logic:
Buyers are likely trapped below the supply zone – we expect liquidity grab before reversal.
A clean bearish impulse is expected once price retests the zone.
📅 Setup valid for Oct 6 – Oct 10, 2025
⚠️ Disclaimer: Educational idea only. This is not financial advice. Always manage your risk before trading.

AUDJPY MULTI TIME FRAME ANALYSISHello traders , here is the full multi time frame analysis for this pair, let me know in the comment section below if you have any questions , the entry will be taken only if all rules of the strategies will be satisfied. wait for more price action to develop before taking any position. I suggest you keep this pair on your watchlist and see if the rules of your strategy are satisfied.
🧠💡 Share your unique analysis, thoughts, and ideas in the comments section below. I'm excited to hear your perspective on this pair .
💭🔍 Don't hesitate to comment if you have any questions or queries regarding this analysis.

A beautiful AUDCHF high RnR scenarioAUDCHF is approaching 4H resistance zone which has already show rejection previously. There is also a steep bullish trend line creating a confluence. RSI has already shown Bearish Divergence. All these signaling a coming very good sell side opportunity. Below are points detailing the same.
1. Price is approaching 4H resistance zone. Which may act as a strong supply zone.
2. Very steep Bullish Trend line developing a confluence at resistance. Steep trend line are always prone for breakout/breakdown.
3. Most probably price will take liquidity of resistance zone and break trend line.
4. After breaking trend line it should pullback till resistance/trend line or any newly created OB/FVG.
5. RSI also already shown Bearish Divergence and running in oversold zone.
All these combinations are signaling a high probability and high Risk and Reward (1:8) trade scenario.
Note – if you liked this analysis, please boost the idea so that other can also get benefit of it. Also follow me for notification for incoming ideas.
Also Feel free to comment if you have any input to share.
Disclaimer – This analysis is just for education purpose not any trading suggestion. Please take the trade at your own risk and with the discussion with your financial advisor.
AUDJPY – High Probability Short Setup (15M)
📊 Market Insight:
AUDJPY has broken intraday structure and is now retracing into the 95.44 – 95.60 supply zone. This level is key for potential downside continuation.
🔑 Setup Details:
Supply Zone: 95.44 – 95.60
Entry Zone: 95.40 – 95.55 (confirmation required)
Targets:
TP1: 95.00
TP2: 94.85 – 94.90
Stop Loss: Above 95.60
🎯 Trading Approach:
I look for rejection or bearish confirmation candles before entering. Strict stop-loss placement and structured exits ensure controlled exposure, a must in fund management.
⚖️ Risk Management Philosophy:
Every trade is positioned with calculated risk allocation to safeguard client capital while compounding returns. Consistency and discipline form the backbone of my strategy.
📩 For Managed Accounts & Professional Trading Guidance
insta@ the_sohailarhaan

AUDJPY SELLSCurrent price action is bearish, with downside momentum confirming bearish order flow. Before considering shorts, I reviewed where price previously pushed higher and identified a key daily demand zone — an unmitigated wick that sparked the last major bullish move. This is important context: even though the 4H structure is bearish, bulls could still step in with enough volume to break supply.
I unfortunately missed the long entry at that demand zone, which would have been an ideal trap for a win–win scenario. For now, I’ve marked the nearest supply zone. Price just missed tapping into it, so I’ll patiently wait for when it taps. And then I’ll look for confirmation to enter shorts if the opportunity sets up.

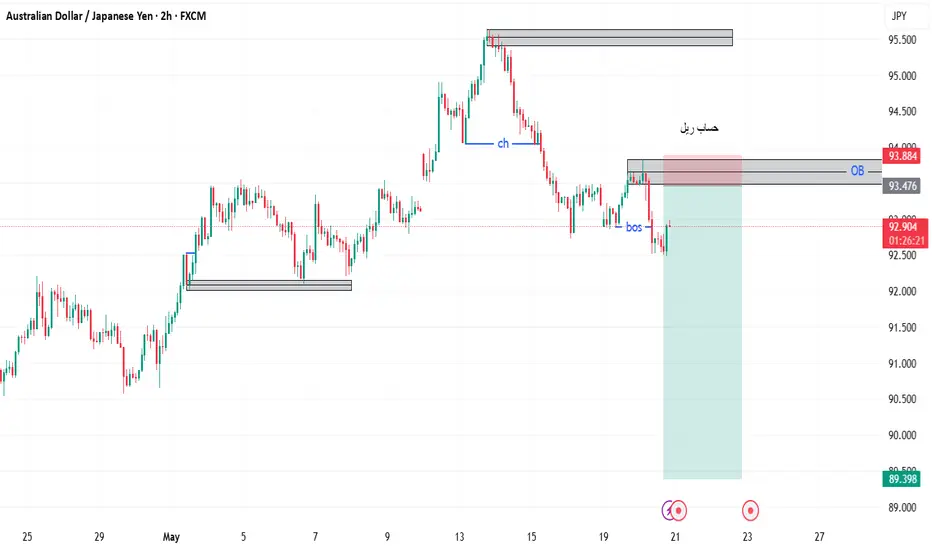
AUDJPY POTENTIAL LONGLooking to take a long position upon the retest of the orderblock that formed after the double purge of both buyside and sellside liquidity. Look for lower timeframe confirmation should you join me.

AUD/JPY SHORT Standard Deviation Projection TargetsThis analysis forcasts a current SHORT trade in AUD/JPY , with Standard Deviation targets + OTE model aliginging with PD Arrays.
1. SD Target 1 - 95.170
2. SD Target 2 - 94.085
Share your thoughts on this!
Follow for more!

AUDJPY SELLSObiviously price is in an downtrend on 4H TIMEFRAME, and it came up into the supply zone. Taking it out, taking out high to the left and then broke previous low, indicating shift of structure. New sell zone is indentefied with 97.0 number in the middle. First target is most recent low, however I do plan on hold this and wait for the price to drop lower.

USD/JPY LONG SWING TRADEThe chart shows a downward trendline with multiple points where the price touched the trendline, marked by red lines and blue arrows. There are horizontal green lines indicating support and resistance levels. The highlighted green area suggests a potential upward move, while the red area marks the stop loss level at 92.5.

ICT analysis AUDjPYHello, I am FXHUNTER. Analysis of the AUDJPY symbol. The trend of this symbol has changed from bullish to bearish and this block order that I have specified is expected to create resistance for the price.
Buy Trade - AUD/JPYGreetings to everyone!
Place a buy trade on AUD/JPY and check out my chart for the ideal entry, stop-loss & target placement.
Remember :-
* Move your SL to breakeven once the trade reaches 1:1.4 R.
* Aim for a minimum reward of 1:1.5 R.
* Don't risk more than 3% of your total margin.
Let's execute this trade smartly! 🚀
💬 About Me:
I am a professional trader with over four years of experience in the markets. I focus on swing trading using the 4H timeframe, mainly in the forex space. The trades I share here are the actual positions I’m executing. I post them as a small gesture to give back to the trading community that’s been a big part of my journey.
Cheers! 🙏
