$LINK Price Outlook | Is $100+ On The Table? | CryptoPatelBIST:LINK Price Outlook | Is $100+ On The Table? | CryptoPatel
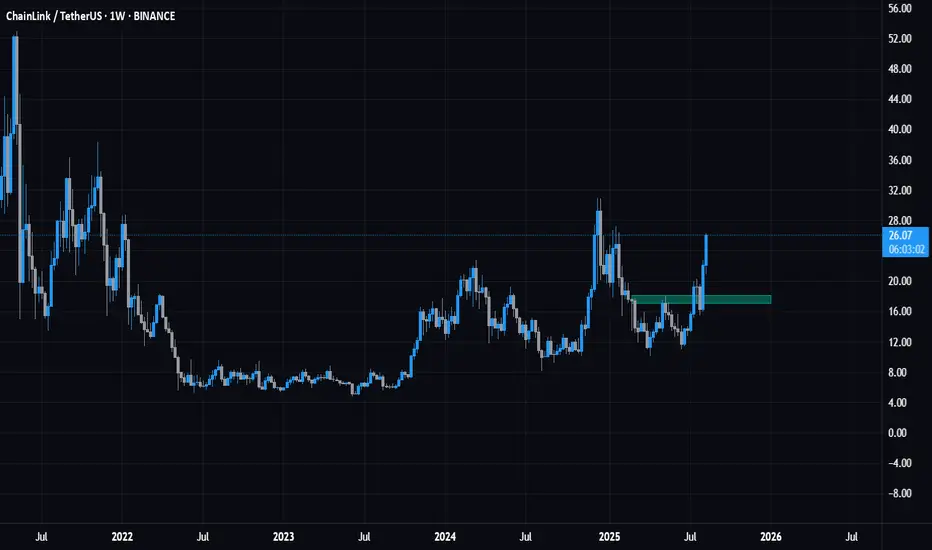
BIST:LINK Is Showing Strong Signs Of A Macro Bullish Reversal After Holding A Multi-Year Support Zone On The 2W Timeframe. The Current Structure Suggests A High-Timeframe Trend Shift That’s Been Building Since The 2021 Top.
Technica
Related pairs

Have patience Here are the buying zones,linkusdt for long.
Have patience big whales will buy when retailers gonna exhaust from this consolidation.
So wait for the perfect entry approx of 11.8$.

LINKUSDT – Trendline Rejection Short Setup (1H)Price has tapped the major descending trendline and is showing rejection signs.
Market structure is still bearish, and price is reacting exactly at the trendline + previous supply zone.
🔎 Trade Idea
Bias: Short
Reason: Price retests descending trendline → shows rejection → aligns with bearish str

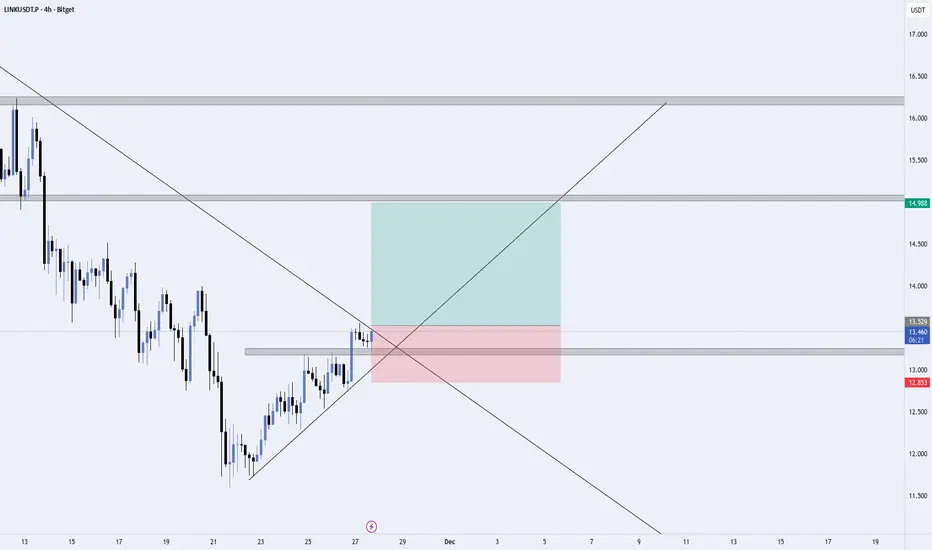
LINK/USDT – Breakout Retest Setup (4H Chart)LINK is showing a potential trend reversal after breaking its major descending trendline.
Price has also retested the previous resistance zone, which is now turning into support.
📌 What I'm Seeing
Strong bullish push from the recent lows
Break above the downtrend line (possible trend reversal)
P
LINK is showing a clear Double Top on 1H chartBIST:LINK – Double Top Forming! 💠
#LINK is showing a clear Double Top on 1H chart (Top 1 at $17.48 & Top 2 at $17.44).
Neckline sits at $16.77 — a critical support zone to watch!
If price closes below $16.77, expect a pullback toward $16.30 – $16.00.
But if bulls regain control above $17.50, mome

$LINK is showing a clear Double Top on 1H chartBIST:LINK – Double Top Forming! 💠
#LINK is showing a clear Double Top on 1H chart (Top 1 at $17.48 & Top 2 at $17.44).
Neckline sits at $16.77 — a critical support zone to watch!
If price closes below $16.77, expect a pullback toward $16.30 – $16.00.
But if bulls regain control above $17.50, mome

LINK - To The Moon? | 3D Chart AnalysisLINK has pulled back into a strong demand zone between $15.4–$16, aligning perfectly with the ascending trendline support that has held since mid-2023.
The recent wick rejection shows early signs of demand returning — if price holds above this area, we could see a potential mid-term reversal formin

LINKUSD – Waiting for Pullback to Support Before Long EntryLINK was recently rejected at resistance, and we’re now watching for a pullback to confirm support before entering a long spot trade.
🔸 Trade Setup
We are targeting a long spot entry around $21.00 – $21.50, which aligns with prior structure and potential buyer interest. This zone could provide a s

Chainlink Crypto buy setup 🚀Chainlink (LINK) Buy Setup – Liquidity Sweep + W Pattern Strategy
The crypto market never runs out of opportunities—and Chainlink (LINK) is currently showing one of the cleanest technical setups for traders who understand Smart Money Concepts (SMC). Let’s break it down step by step.
---
1. Market
Link possible movement Link at its resistance area now if it break successfully then on the retest we can go for long if BTC holds or up from here
Scenario 2 if unable to break then we can short on the trend line break down

See all ideas
Summarizing what the indicators are suggesting.
Oscillators
Neutral
SellBuy
Strong sellStrong buy
Strong sellSellNeutralBuyStrong buy
Oscillators
Neutral
SellBuy
Strong sellStrong buy
Strong sellSellNeutralBuyStrong buy
Summary
Neutral
SellBuy
Strong sellStrong buy
Strong sellSellNeutralBuyStrong buy
Summary
Neutral
SellBuy
Strong sellStrong buy
Strong sellSellNeutralBuyStrong buy
Summary
Neutral
SellBuy
Strong sellStrong buy
Strong sellSellNeutralBuyStrong buy
Moving Averages
Neutral
SellBuy
Strong sellStrong buy
Strong sellSellNeutralBuyStrong buy
Moving Averages
Neutral
SellBuy
Strong sellStrong buy
Strong sellSellNeutralBuyStrong buy
Displays a symbol's price movements over previous years to identify recurring trends.
Frequently Asked Questions
The current price of LINK / UST (LINK) is 8.50000000 USDT — it has risen 0.16% in the past 24 hours. Try placing this info into the context by checking out what coins are also gaining and losing at the moment and seeing LINK price chart.
LINK / UST price has fallen by −6.35% over the last week, its month performance shows a −32.91% decrease, and as for the last year, LINK / UST has decreased by −53.64%. See more dynamics on LINK price chart.
Keep track of coins' changes with our Crypto Coins Heatmap.
Keep track of coins' changes with our Crypto Coins Heatmap.
LINK / UST (LINK) reached its highest price on May 10, 2021 — it amounted to 52.94300000 USDT. Find more insights on the LINK price chart.
See the list of crypto gainers and choose what best fits your strategy.
See the list of crypto gainers and choose what best fits your strategy.
LINK / UST (LINK) reached the lowest price of 4.77700000 USDT on Jun 10, 2023. View more LINK / UST dynamics on the price chart.
See the list of crypto losers to find unexpected opportunities.
See the list of crypto losers to find unexpected opportunities.
The safest choice when buying LINK is to go to a well-known crypto exchange. Some of the popular names are Binance, Coinbase, Kraken. But you'll have to find a reliable broker and create an account first. You can trade LINK right from TradingView charts — just choose a broker and connect to your account.
Crypto markets are famous for their volatility, so one should study all the available stats before adding crypto assets to their portfolio. Very often it's technical analysis that comes in handy. We prepared technical ratings for LINK / UST (LINK): today its technical analysis shows the strong sell signal, and according to the 1 week rating LINK shows the sell signal. And you'd better dig deeper and study 1 month rating too — it's sell. Find inspiration in LINK / UST trading ideas and keep track of what's moving crypto markets with our crypto news feed.
LINK / UST (LINK) is just as reliable as any other crypto asset — this corner of the world market is highly volatile. Today, for instance, LINK / UST is estimated as 5.02% volatile. The only thing it means is that you must prepare and examine all available information before making a decision. And if you're not sure about LINK / UST, you can find more inspiration in our curated watchlists.
You can discuss LINK / UST (LINK) with other users in our public chats, Minds or in the comments to Ideas.