SAUD trade ideas

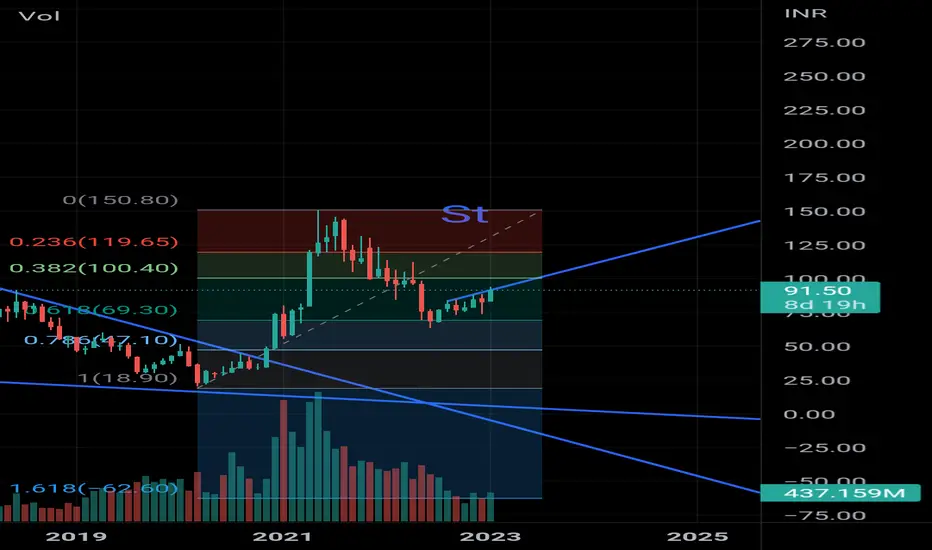
Trendline Breakdown in Steel Authority Of India Limited...Chart is self explanatory.
Disclaimer: This is for demonstration and educational purpose only. This is not buying or selling recommendations. I am not SEBI registered. Please consult your financial advisor before taking any trade.

SAIL Bullish; above 89.70 on Monday 20 Mar for IntradayExercise caution as broader market is bearish.
Please check out the INTRADAY Trading Strategy in the COMMENTS section below during the live market hours:
---------------------------------------------------------------------------------------------------------------------
1) Impulse upmove stage: The strong upmove (nearly upto 2% from breakoutprice) happens within the first five to 15 minutes. "High Risk Traders" buys in hope of another 2% upmove intraday.
"High Risk Traders" may have to patiently wait through the Pullback-Consolidation stage to realize profits. High risk/High reward set up as breakouts may fakeout (reversal)also
2) Pullback-Consolidation stage: After the above "Impulse upmove stage"; the price may then pull back and move sideways (between "Open" price and "High" of the above "Impulse upmove stage").
Safe traders with minimum risk profile may Wait for a breakout from the consolidation to enter at this stage to relize high profits in the final intraday final "Breakout continuation" stage
3) Breakout continuation: Stocks often in the third stage breaks up above the "High" of the first "Impulse upmove stage" and continue to go higher again.
Both Safe Traders/High Risk Traders may book profits at this stage
Stop Loss: You may keep the stop loss @ "Open" price of the day OR "Breakoutprice"
The above information is not meant to be, and do not constitute, financial, investment, trading, or other types of advice or recommendation.

Sail BullishSAIL closing 87.4 with stoploss 83 then targets are 93-100.
Buying Reason.
1 --> Price made a good move and close above ema.
2 --> RSI is ready to cross 60.
3 --> ADX is show the bullish move and +DMI rise.
4 --> Volume is also good.

Sail can be brought above 88.2Sail has created a bottom. I am very bearish on nifty, expecting levels of 16500.
But stocks can go in other directions.
Sail is showing signs of reversal. If it crosses recent high then 6% target is possible.
I have drawn strong support and resistance lines.
Hope it helps.
I am not a SEBI registered trader. Only for educational purpose.

Long SAILSail as per price and time analysis crossing 86.8 then 94 can be seen .
This analysis is based on Hurst price and time breakout analysis.

New wave in SAILSAIL has completed a downtrend Elliot wave and started with a fresh wave initiation.
Can initially reach 89-90. Any break out above 90 could lead to a bigger impulse.

SAIL @ 84.55 Analysis on 11-Feb-2023SAIL @ 84.55 Analysis on 11-Feb-2023
As long as 61/19 holds support, we can see 178-193, 274-300 in the long run.

SAIL 30TH JAN 2023 SWING TRADESwing trading ideas
lets, watchout for this stock and see how this trade works out
taking support multiple times,
Buy after breakout of resistance line,
weekly support

Triangle pattern BreakoutPlease look into the chart for a detailed understanding.
Consider these for short-term & swing trades with 2% profit.
For BTST trades consider booking target for 1% - 2%
For long-term trades look out for resistance drawn above closing.
Please consider these ideas for educational purpose

SAIL 1 DAY INVERSE HEAD AND SHOULDER 1) sail formed inverse head and shoulder patter
2) it's breakout and retest succesfully then we can trade this stock
3) enter price 92-93 is best price to trade
4) stop loss : 85

Swing idea for 11-12% || SAILBreakout-retest and continuation pattern. Buy at CMP of 93 for a target of 96.5 and 104. SL will be 87.5.

SAIL-RIGHT TIME TO ENTER~The information given in the chart is for the educational purpose only.
~Do your own analysis before investing.

Will trend continue...This PSU stock also backed by very good fundamentals may give best returns in upcoming days.As you can see in the above picture the up trend is continue in this stock it will definitely give good movement after budget also

SAIL - WEEKLY- CMP 87.80Closing above 90 would confirm breakout.
Buy for targets 96-105
Broader view targets 112 - 120
SL - closing basis 79

Swing trade. Education purpose onlyBreakout of trend line. Can go long.
Note :- Not an advice
Thank you

Triangle pattern Breakout in SAILTriangle pattern Breakout in SAIL
From the past 2 years stock was in a down trend forming triangle pattern. Finally it has given breakout from this down trend on 02/01/23 with good volume. In todays trading session price has managed to close above breakout candle. We can expect a decent uptrend in coming days.
All possible targets are marked on the chart. Maintain strict stop loss at 72.5
This is just a view, not recommendation to trade. Do your own analysis before making any investment.
Do like and share this idea and share your opinion in the comment section.
NSE:SAIL

Start of Zigzag wave C or Impulse wave 3.Get longAs depicted in the chart we have completed up move in 5 wave's followed by 3 wave corrective move.Hence it can be assumed that current rise from 68 is either a zigzag ABC or a start of new impulse,in either case we can expect this up move to continue and can take price between 92-100 levels.
Target for zigzag wave c is 92-95.
Target for impulse ave 3 is 100.75.
As per classic elliot wave we have surpassed wave B top of 81 in todays trading session along with wave 5's top of 82.15 which is suggesting to go long with a stop-loss of 77 for above mentioned targets.
Risk-reward for zigzag wave C is 1:2
Risk-reward for impulse wave 3 is 1:3.
Today if we get closing above 81,then one can go long.
Disclaimer:This are just my views on the stock,no positions should be taken solely on its basis,publishing this for my future reference.

Long position in SAILThis is continuation of my previous idea on Sail long position. After a false breakout now sail is heading to the TP2. Rs 111 and from there after creating a support it will directly head towards TP3. Rs 158.
If you like the idea then do like comment and follow me for more ideas and chart analysis.

SAIL Daily looking bullishSAIL Daily looking bullish, It has trendline breakout with 200 ema support on daily candle.
Good to buy at 88 for targets of 113,141 with sl below 83

SAIL Cmp 89 dated 2-1-2023 Triangle BO above 90SAIL Cmp 89 dated 2-1-2023
1. Trendline & Triangle BO above 90.
2. Volume Surge
Buy above 90 for target 94-96-100 SL 83
Higher target of Pattern 115 SL 80
Disclaimer :
I am not a SEBI registered Analyst so please do your own Analysis before taking any action.
The above view is shared just for educational purpose.
By no means shall be responsible for any losses amounting out of it incase if any trades on it.
It is just a view, please trade at your own risk.

SAIL - Trendline BOSAIL - A clear BO of trendline, good move and volume
Consider for long
Take trade as per your risk reward ratio.
