M&M 1hr analysisM&M has previously broken the support and now
it has regained it, it has even broken the trendline
and it has given a retest, it would be a perfect
level to enter, 795 should be the target.
MHNDR trade ideas


M&M triangle pattern breakout with reverse Head & ShoulderM&M triangle pattern breakout with reverse Head & Shoulder NSE:M_M
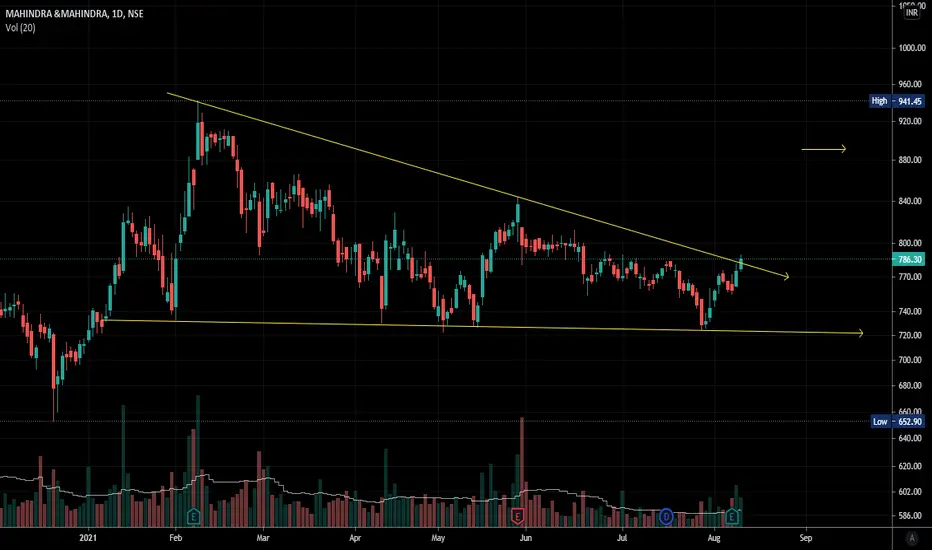
M&MStock has given breakout from descending triangle pattern. Buy above 780 TGT 8 to 10% SL 750. For educational purpose only. Kindly contact your financial advisor before entering any trade.

MEDIUM TERM TRADE - M&MA clean pole and Flag pattern in M_M.
M_M is consolidating inside an descending triangle which can be considered as a flag in higher time frame for a long time . now it has given a breakout from the pattern and we can try for an opportunity in here.
entry = 785
target = 950
sl = 750

Support and resistance It is on daily 200 MA support stock retraces to much now its time for breakout for the stock it is very good stock it is also on daily support


Mahindra & Mahindra Breakout chartMahindra & Mahindra looks good on chart and also auto sector's results will be fantastic.

Given a fresh breakout with volume. Given a fresh breakout with volume and successfully closed above trendline (767)
Can look for Target of 868 with stoploss of 721 closing basis.
I am not much into chart publishing,any type of suggestions are welcome.


M&M Breakout - Good RR setup Mahindra has broken out of the triangle pattern. looks good for positional traders with low risk and high reward. SL targets are mentioned on the chart.


Simple Trade Setup | M&M | 09-08-2021NSE:M_M
Simple Trade Setup for M_M for 09-08-2021.
Chart and levels are easy to understand.
Do comment your doubt or suggestion.
all the best for trading in next week.

mahindra and mahindra chart analysismahindra and mahindra chart analysis for intraday and swing trading

Mahindra & Mahindra : head and shoulder weekly potential shorti would like short Mahindra and Mahindra for the breach of a possible head and shoulder pattern working out.
all timeframes are in sideways right however for swing trades it may make sense to see if momentum dips further below 40
to be sure.Auto sector also in general is not doing that great either in short term.


M&MPole and flag pattern in progress on chart. One can look for long opportunities, if breakout happens on chart.

Add M&M to your WatchlistIt is in a good phase and can give breakout in either direction and in Few Weeks

M&MWith increased volume and increased sales ..........................................................................

M_M LongAfter consolidating for months finally its time for a good move, currently broke out of trendline resistance in hourly chart. Targets are mentioned in the chart with sl of closing below the trendline in DC.
Note: Not a buy recommendation.


M_M M_M Looking Good on Chart Sustaining Above 760
Add Every dip Stop-Loss 740 (Safe) 720 (Risky)
Target 780-800-825-850+++ Highly Risky One Positional Call
If Sustaining above 850 Target will be 900-950-1000+++

MAHINDRA & MAHINDRA For INTRADAYFOR INTRADAY PURPOSE
BUY ABOVE 734
SL:- 732
TARGET:- 742
THIS ANALYSIS IS PURELY BASED ON PRICE ACTION
FOR EDUCATIONAL Purpose
Before taking any decision please concern your financial advisor.
