MHNDR trade ideas


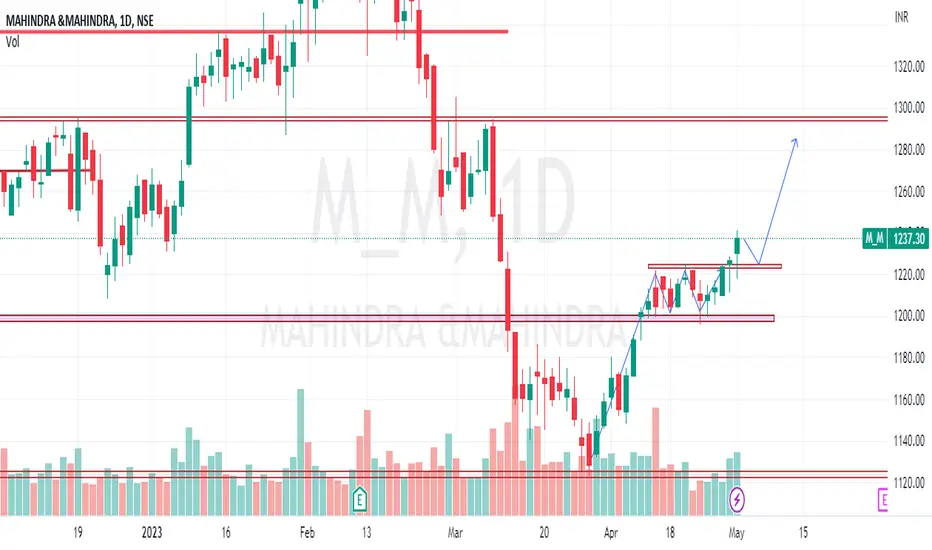
M_M - CASHLooks like the stock has break the Resistance level of 1224-1227.
Will create a Long position here for target of 1320-1334 with a stop loss at 1200.

Mahindra and Mahindra Flag pattern breakoutMahindra and Mahindra Flag pattern breakout
it might retest
good to keep on radar
Mahindra and Mahindra showing strength for buyM&M stocks has entered into a curcial zone and is looking bullish with increase in delivery percentage...
can be a good buy
Holding Period - few weeks/months
targets- Long

Flag Pattern In the context of technical analysis, a flag is a price pattern that, in a shorter time frame, moves counter to the prevailing price trend observed in a longer time frame on a price chart. It is named because of the way it reminds the viewer of a flag on a flagpole.
The flag pattern is used to identify the possible continuation of a previous trend from a point at which price has drifted against that same trend. Should the trend resume, the price increase could be rapid, making the timing of a trade advantageous by noticing the flag pattern.
Script= M&M
Time Frame = 1 Day

My view on M&MCup & Handle forming in M&M
Above 1225
Tgt 1240-1250-1260++
in very short term
Keeping on radar M&M 1240 CE (May)

M&MM&M broke out of descending channel on an hourly chart with decent volumes.
Could be bought with mentioned stoploss & target.
Please comment if you like my charting techniques, suggestions welcome.

M&M Long OpportunityIf price comes at entry level before reach @ target level then for go long.
Trade at your own risk.

M&M (INTRADAY+POSITIONAL)M&M ABOVE TO BREAKOUT OF ASCENDING TRIANGLE PATTERN ON 30 MIN tf with decent volumes.
Could be bought with mentioned stoploss & targets.

MHINDRA & MAHINDRAIf it will cross above 1230 it will move sharp, now a day try to come out from it supply zone

MULTIPLE BULLISH PATTERN IN M&MWe Can See Three White Solders in Daily TF near support zone
Followed by Consolidation Candle
Inverted H& S in 1 Hr TF
And Dynamic Trendline Breaking
Any Dip an be considered as buying opportunity keeping SL as 1135

M&MM&M broke out of inverse head n shoulder pattern on an hourly/daily charts with godd volumes.
Could be bought with mentioned stoploss & target.

MAHINDRA & MAHINDRA TARGET 1290MAHINDRA & MAHINDRA inverse head and shoulder breakout in a day chart. If open and sustains above 1192 it will reach 1290

MAHINDRA AND MAHINDRA : HOLD SET UPMahindra and Mahindra Limited is an India-based company that is primarily engaged in the mobility products and farm solutions. The Company’s segments include Automotive and Farm Equipment. On weekly time frame , the Chart is making a Broadening Triangle Pattern . A Broadening Triangle Pattern can be characterized as a bullish reversal pattern. This pattern is created when the highs become progressively higher, and the lows become progressively lower. This creates a "broadening" effect on the chart. The occurrence of this pattern indicates that selling pressure is weakening, and buyers are starting to step in. A breakout above the resistance level signals a potential trend change. The pattern is said to get its name because the chart looks like a broadening formation. Sometimes this pattern is called a megaphone bottom or a reverse symmetrical triangle. . While this pattern looks bearish at first, it's actually a bullish sign. It indicates that the stock is gaining momentum and is likely to continue to move higher. This is a great opportunity to get in on the action and reap the rewards of a market reversal. Once you see that the stock price is rising above the support level as it is happening in our case, it is a good time to buy. The broader is the triangle , higher is the probability of break out, through the top of the pattern.
CMP : 1185.50
PRIMARY TARGET : 1410.10
STOP LOSS : 1122.00
Risk Reward Ratio ( 63:225 ) = 1:3.6
RSI (14) = 46.30 (< 80 )
ADX (Directional Strength ) = 42.56 ( > 20 )
ATR : 23.93 ( Less Volatile )
50EMA(Weekly Time Frame ) : 1179.00 ( Support )
Exit , once our primary Target is achieved .Then , we wait for the confirmation of breakout /breakdown. Re-Enter the trend after CONFIRMATION OF BREAK OUT/BREAK DOWN accordingly.

Mahindra and Mahindra Inverted head and shoulders
Good upside target once BO.
Only educational purpose.

Mahindra & Mahindra Entry Point on 23/03/23 positive trade, RSI in the lowest, signaling the end of a downtrend, which means an upward moment can be seen in the immediate term in next one to two days, target price is at 1189, if I enter right now on delivery, 174 is a good exit point, profit is obviously directly proportional to capital so this idea is for those trading with at least 100000/- INR who can make a quick buck playing safely, an upward moment is imminent

M&M Looks BearishM_M Looks Bearish on Daily timeframe.
M_M has given a fake move upside, where it did not sustain. This has caused a reversal move in M_M, and it can probably take out the Strong Support zone as it has been tested multiple time.

LONG CALL ON M&MBreakout on the stock
crossing previous two days high
Target 1190/1215
Stop loss 1160
I am just representing my views
For educational purpose only.

Mahindra & Mahindra - Intraday Trade Levels || 22nd March, 2023 Analysis Criteria Used:
1. Please find the Chart Analysis done for the 22nd March, 2023
2. The analysis for the Intraday Trade ideas, has been done based on Trend analysis and Chart Patterns with Volume Buildups
Focus On:
1. Always keeping your Risk Management in play
2. Using a Stop Loss; because it is your Best Friend
3. Always Plan your Trade and stick to your Plan
4. Dont overthink or overanalyse
5. Treat this as your Business and get serious about it
#sharemarket #stockmarket #nifty #sensex #investing #trading #nse #bse #stockmarketindia #stocks #indianstockmarket #investment #stockmarketnews #banknifty #finance #money #intraday #intradaytrading #investor #niftyfifty #dalalstreet #sharemarketindia #sharemarketnews #stockmarketinvesting #business #sharemarkettips #stock #india #indiansharemarket #rakeshjhunjhunwala #bhfyp #mumbai #share #wealth #investment #market #invest #trading #investing #finance #FinancialFreedom #investor #trader #stocks #profit #investors #economy #equity #shares #nifty #stockexchange
DISCLAIMER:
𝙊𝙪𝙧 𝘼𝙣𝙖𝙡𝙮𝙨𝙞𝙨 𝙞𝙨 𝙛𝙤𝙧 𝙀𝙙𝙪𝙘𝙖𝙩𝙞𝙤𝙣𝙖𝙡 𝙥𝙪𝙧𝙥𝙤𝙨𝙚𝙨 𝙤𝙣𝙡𝙮.
* Please do your own research and/or contact your financial advisor before taking any trading opportunities
** We will not be responsible for your profit or loss
*** We are NOT SEBI REGISTERED
______________________
best stocks to buy today
best stocks to buy now
best stocks to buy
best stocks for Intraday tomorrow
best stocks for long term investment
best stocks to buy today india
best stocks for swing trading
swing trading strategies
swing trading beginners
what is swing trading
swing trading stocks
swing trading stock selection
swing trading kya hai
nifty analysis
nifty view
bank nifty analysis
top stocks to buy now
strong stocks
nifty view
nifty prediction
stock market view tomorrow
bank nifty Levels
bank nifty prediction
share news
stock market news
best stocks to buy now
profit booking stocks
multibagger stocks in discount
breakout stocks
best short term stocks
best short term shares
next multibagger stocks

swing trade in Mahindra and Mahindrahigh volume activity at the consolidation zone and POC has also shifted in this zone. we will go long above consolidation breakout.

Mahindra share @harishwaveanalystMahindra share elliot wave analysis for daily time full explain daily chart
current time price go down Wave c internal wave 1,2,3,4 or 5

buy m&mit has formed AB=CD harmonic pattern. it may retrace till 0.38%-0.50% of point CD. view negated below 1135 closing basis.
