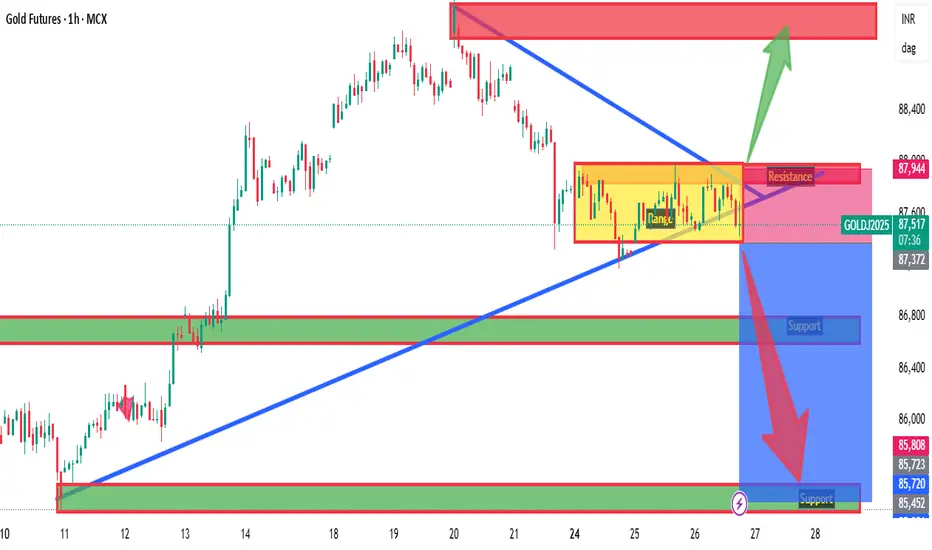
Gold Intraday Levels : 26 & 27-Mar-25
Gold Important zones mentioned on chart
Bearish < 87370
Bullish > 88000
Wait for Proper Rejection/Pattern :
@Support : Bullish
@Resistance : Bearish
*All views for educational purpose only
Gold Petal Futures
Trade ideas
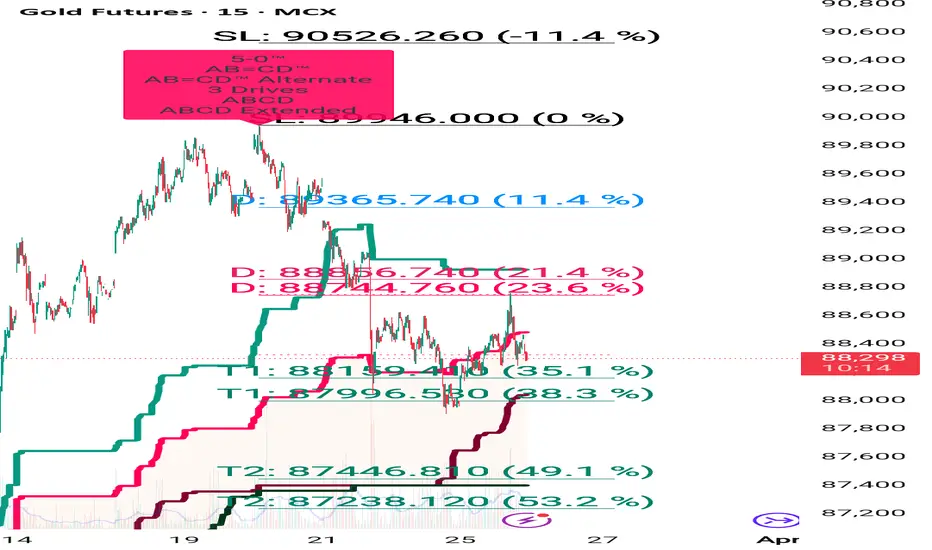
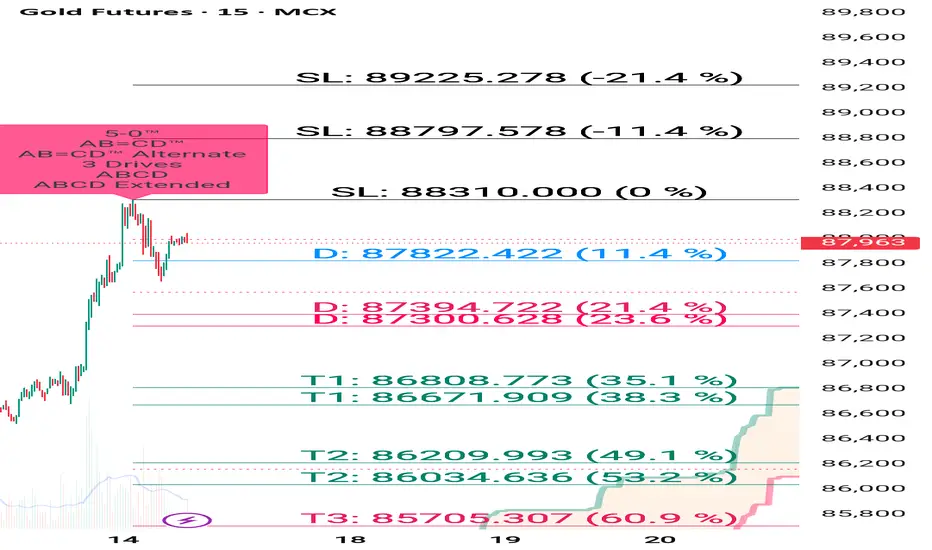
Gold mcx holding sell from 88680 , downside Target on chart How to take trades using Harmonic pattern projection Trade setup is explained below :-
Entry : 1st SL point : 0% is recent top or bottom.
Trailing D: 11.4% is work as trailing SL of buy or sell trade if hit then we have to book profit
.If price goes below 2nd D 21.4% to 23.6% range then early traders can make fresh reversals trade after breaking 1st D 11.4% safe traders can reversal trade after breaking Point D 21.4% to 23.6% range
Targets :
Target T1 : 35.1% to 38.3%
Target T3 : 49.1% to 53.2%
T3: 60.9% to 64.8% is our 3rd Target since this is reversal zone so must book profit if break then take fresh trade again
Target T4 : 76.4% to 79.7%
Next Targets are 100% , 127.2% ,141.4% and final Target 161.8%.
How to take reversal trade :
If price going upside/ downside then then buy or sell levels appear on Chart ( Automatically show when price reach any reversal zone of harmonic projection pattern based .
After showing reversal levels wait for confirmation until 21.4% or 28.3 % level not break if break then exit from current buy / sell trade and take fresh reverse trade buy/ sell .
Trailing SL:
After reach 1st Target trail SL to just above or below cost ( for example we are holding sell trade from 100 1st Target 110 hit then move trailing sl to 104-105 and move SL as price move upside or Downside)
Re- Entry :
For Re-entry in any pull back Point D ( 11.4% ) is used for re-entry then SL recent high or low Point SL ( 0% ) .
Blue Line is 1st support/ Resistance
Green line is 2nd support/ resistance
Red line is 3rd Support/ resistance
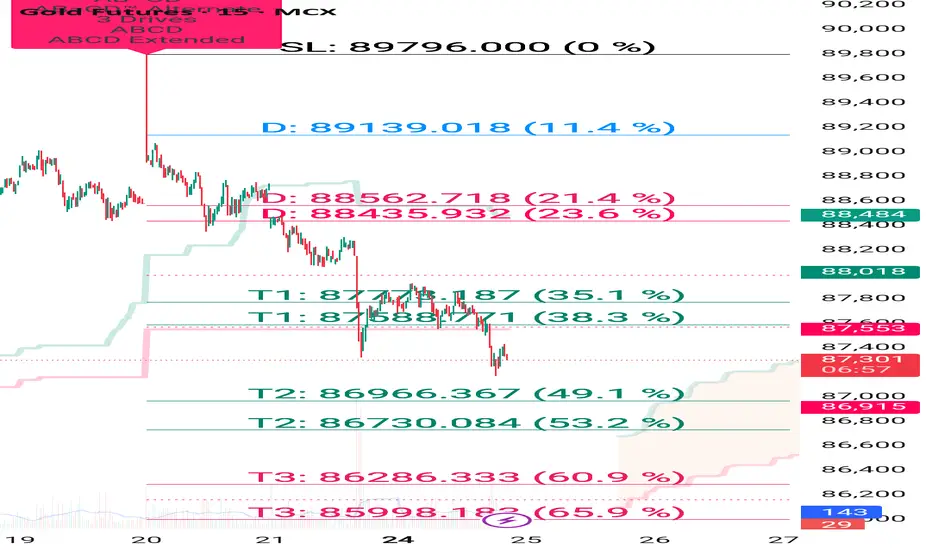
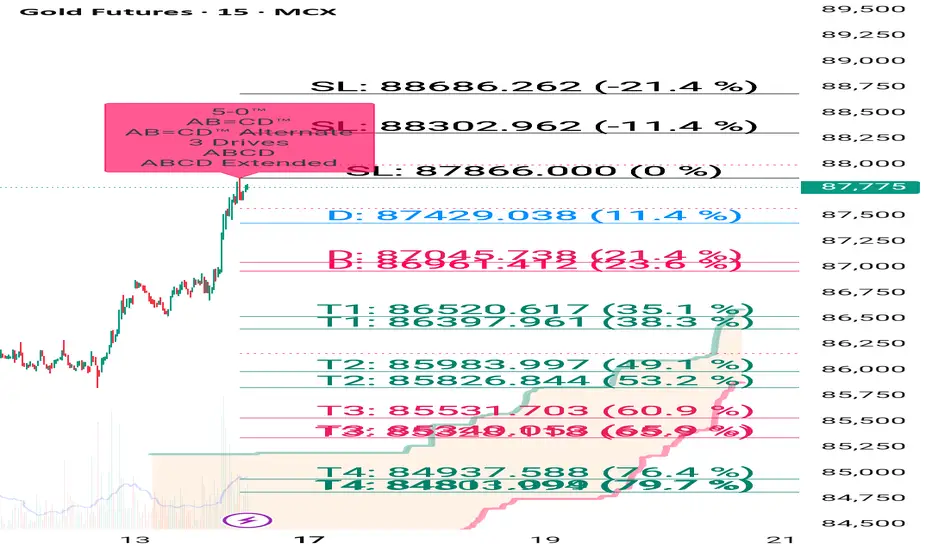
Gold breaks support sell on rise until 88500 not break How to take trades using Harmonic pattern projection Trade setup is explained below :-
Entry : 1st SL point : 0% is recent top or bottom.
Trailing D: 11.4% is work as trailing SL of buy or sell trade if hit then we have to book profit
.If price goes below 2nd D 21.4% to 23.6% range then early traders can make fresh reversals trade after breaking 1st D 11.4% safe traders can reversal trade after breaking Point D 21.4% to 23.6% range
Targets :
Target T1 : 35.1% to 38.3%
Target T3 : 49.1% to 53.2%
T3: 60.9% to 64.8% is our 3rd Target since this is reversal zone so must book profit if break then take fresh trade again
Target T4 : 76.4% to 79.7%
Next Targets are 100% , 127.2% ,141.4% and final Target 161.8%.
How to take reversal trade :
If price going upside/ downside then then buy or sell levels appear on Chart ( Automatically show when price reach any reversal zone of harmonic projection pattern based .
After showing reversal levels wait for confirmation until 21.4% or 28.3 % level not break if break then exit from current buy / sell trade and take fresh reverse trade buy/ sell .
Trailing SL:
After reach 1st Target trail SL to just above or below cost ( for example we are holding sell trade from 100 1st Target 110 hit then move trailing sl to 104-105 and move SL as price move upside or Downside)
Re- Entry :
For Re-entry in any pull back Point D ( 11.4% ) is used for re-entry then SL recent high or low Point SL ( 0% ) .
Blue Line is 1st support/ Resistance
Green line is 2nd support/ resistance
Red line is 3rd Support/ resistance
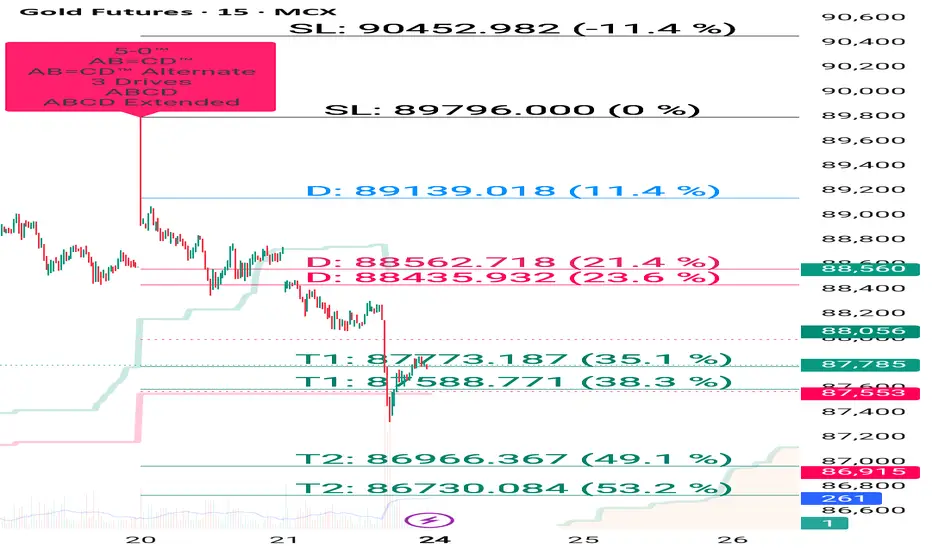
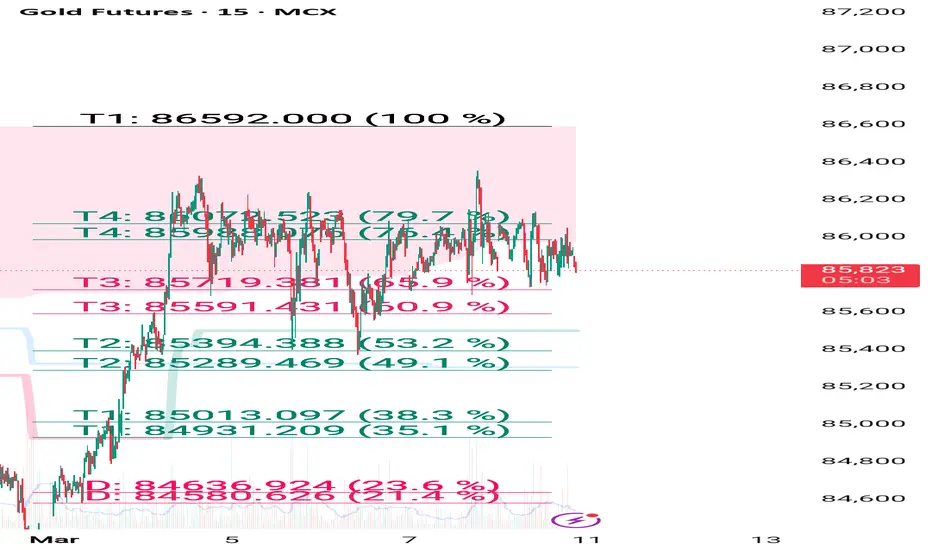
Gold until 87300 not break buy on dip Target 89100,89750 How to take trades using Harmonic pattern projection Trade setup is explained below :-
Entry : 1st SL point : 0% is recent top or bottom.
Trailing D: 11.4% is work as trailing SL of buy or sell trade if hit then we have to book profit
.If price goes below 2nd D 21.4% to 23.6% range then early traders can make fresh reversals trade after breaking 1st D 11.4% safe traders can reversal trade after breaking Point D 21.4% to 23.6% range
Targets :
Target T1 : 35.1% to 38.3%
Target T3 : 49.1% to 53.2%
T3: 60.9% to 64.8% is our 3rd Target since this is reversal zone so must book profit if break then take fresh trade again
Target T4 : 76.4% to 79.7%
Next Targets are 100% , 127.2% ,141.4% and final Target 161.8%.
How to take reversal trade :
If price going upside/ downside then then buy or sell levels appear on Chart ( Automatically show when price reach any reversal zone of harmonic projection pattern based .
After showing reversal levels wait for confirmation until 21.4% or 28.3 % level not break if break then exit from current buy / sell trade and take fresh reverse trade buy/ sell .
Trailing SL:
After reach 1st Target trail SL to just above or below cost ( for example we are holding sell trade from 100 1st Target 110 hit then move trailing sl to 104-105 and move SL as price move upside or Downside)
Re- Entry :
For Re-entry in any pull back Point D ( 11.4% ) is used for re-entry then SL recent high or low Point SL ( 0% ) .
Blue Line is 1st support/ Resistance
Green line is 2nd support/ resistance
Red line is 3rd Support/ resistance
Gold mcx closing at support still buy on dip for positionalHow to take trades using Harmonic pattern projection Trade setup is explained below :-
Entry : 1st SL point : 0% is recent top or bottom.
Trailing D: 11.4% is work as trailing SL of buy or sell trade if hit then we have to book profit
.If price goes below 2nd D 21.4% to 23.6% range then early traders can make fresh reversals trade after breaking 1st D 11.4% safe traders can reversal trade after breaking Point D 21.4% to 23.6% range
Targets :
Target T1 : 35.1% to 38.3%
Target T3 : 49.1% to 53.2%
T3: 60.9% to 64.8% is our 3rd Target since this is reversal zone so must book profit if break then take fresh trade again
Target T4 : 76.4% to 79.7%
Next Targets are 100% , 127.2% ,141.4% and final Target 161.8%.
How to take reversal trade :
If price going upside/ downside then then buy or sell levels appear on Chart ( Automatically show when price reach any reversal zone of harmonic projection pattern based .
After showing reversal levels wait for confirmation until 21.4% or 28.3 % level not break if break then exit from current buy / sell trade and take fresh reverse trade buy/ sell .
Trailing SL:
After reach 1st Target trail SL to just above or below cost ( for example we are holding sell trade from 100 1st Target 110 hit then move trailing sl to 104-105 and move SL as price move upside or Downside)
Re- Entry :
For Re-entry in any pull back Point D ( 11.4% ) is used for re-entry then SL recent high or low Point SL ( 0% ) .
Blue Line is 1st support/ Resistance
Green line is 2nd support/ resistance
Red line is 3rd Support/ resistance

Gold Futures: Breaking New Highs During Market UncertaintyTechnical Analysis:
Gold prices have been experiencing a consistent uptrend for the past few months, attracting significant investor interest in both physical and virtual gold. Analyzing the gold futures chart since 2016, we observe a steady pattern of higher lows, confirming a strong bullish trend.
From 2020 to 2023, gold faced a strong resistance at the ₹55,000-₹56,000 zone multiple times, acting as a key barrier. This level was tested in 2020, 2022, and 2023 before finally being taken out in March 2023. Post-breakout, this zone flipped into support, leading to a rally towards ₹61,000-₹62,000, which then acted as the next resistance. After multiple tests, the resistance at ₹61,000-₹62,000 was broken in November 2023, turning into strong support by December 2023.
Gold's steady rise in 2024 led to new all-time highs at ₹65,000 in March 2024 and later at ₹73,500-₹75,000. This resistance was tested six times before finally breaking in September 2024, again flipping into support. Post this breakout, gold surged to ₹79,000-₹80,000 in October 2025, which acted as resistance before being broken in January 2025.
In March 2025, gold futures reached a strong resistance level of ₹86,300-₹86,600, tested multiple times. For two months (February and March 2025), this zone was a key resistance, with the ₹84,000-₹84,500 zone acting as support. Finally, on March 12, 2025, the ₹86,300-₹86,600 resistance was broken, turning into support by March 13, 2025. Subsequently, gold created a new all-time high on March 14, 2025. After consolidating for two days, gold surged again and created a new All Time High at 89,796 now trading near ₹88,000 levels.
Historically, previous resistance zones have turned into support, offering attractive investment opportunities. Moving forward, traders and investors should monitor these key support and resistance levels. If gold continues its uptrend, we may see new resistance levels at ₹90,000, ₹91,000, and ₹92,000, acting as psychological barriers. Conversely, any correction could see previous supports playing a crucial role.
So the Previous supports are:
₹86,300-₹86,600 ---> Near Support
₹84,000-₹84,500 ---> Next Support
₹79,000-₹80,000 ---> Far Support
₹73,500-₹75,000 ---> Major Support
Fundamental Analysis:
Gold Futures price in India have created an all-time high of approximately ₹89,796 as of March 20, 2025, reflecting a strong upward trend. This surge is attributed to several key factors:
Global Economic Concerns: Recent U.S. tariffs imposed by President Donald Trump have raised fears of economic instability and inflation, prompting investors to flock to gold as a safe-haven asset.
Central Bank Accumulation: Major central banks worldwide are increasing their gold reserves as a hedge against currency fluctuations and economic downturns.
Strong Historical Performance: Over the last decade, gold prices have risen significantly, climbing from ₹29,600 in 2013 to ₹88,500 in 2025.
Inflation: Gold is traditionally considered a hedge against inflation. When inflation rises, the purchasing power of currencies decreases, and gold tends to retain its value.
Currency Fluctuations: The value of the US dollar plays a significant role in gold prices. When the dollar weakens, gold becomes relatively cheaper for investors using other currencies, leading to increased demand.
Indian Cultural Factors: In India, gold has significant cultural and traditional value. Demand for gold surges during festive seasons like Diwali and during wedding seasons, further contributing to price increases.
Interest Rates: When interest rates are low, gold tends to be more attractive as an investment, as holding gold does not provide interest, so low interest rates reduce the opportunity cost of holding gold.
In summary, a combination of global economic factors, financial market dynamics, and specific cultural aspects in India contribute to the rising gold prices.
Impact on Related Stocks:
Several companies are benefiting from the rise in gold prices, including:
Titan Company (owner of Tanishq) – a leading jewelry retailer.
Muthoot Finance – a major gold loan provider.
PC Jeweller – a fast-growing jewelry company.
These companies are likely to see higher profit margins and revenue growth as demand for gold remains strong.
Investment Considerations
Investing in gold comes with both advantages and risks:
✅ Pros:
Acts as a store of value during economic uncertainty.
Serves as a hedge against inflation.
Provides portfolio diversification.
❌ Cons:
Limited short-term gains.
Price volatility.
No passive income (unlike stocks paying dividends).
Investment Options
Investors can gain exposure to gold through multiple avenues:
Physical gold – Traditional form, but involves storage and security concerns.
Gold ETFs – Easy liquidity and lower costs.
Sovereign Gold Bonds (SGBs) – Backed by the government and offer interest income.
Gold stocks – Investing in gold-related companies.
Conclusion
Gold's strong performance and recent all-time highs highlight its importance as a hedge against global uncertainties. Investors should watch key support and resistance levels, as well as global economic trends, before making investment decisions. A balanced strategy aligned with financial goals and risk tolerance will be crucial for maximizing returns in gold investments.
Disclaimer: This analysis is for educational purposes only. Investors should conduct their own research before making any trading decisions.

Gold mcx holding again buy from 88490 hold buy trade for tomorowHow to take trades using Harmonic pattern projection Trade setup is explained below :-
Entry : 1st SL point : 0% is recent top or bottom.
Trailing D: 11.4% is work as trailing SL of buy or sell trade if hit then we have to book profit
.If price goes below 2nd D 21.4% to 23.6% range then early traders can make fresh reversals trade after breaking 1st D 11.4% safe traders can reversal trade after breaking Point D 21.4% to 23.6% range
Targets :
Target T1 : 35.1% to 38.3%
Target T3 : 49.1% to 53.2%
T3: 60.9% to 64.8% is our 3rd Target since this is reversal zone so must book profit if break then take fresh trade again
Target T4 : 76.4% to 79.7%
Next Targets are 100% , 127.2% ,141.4% and final Target 161.8%.
How to take reversal trade :
If price going upside/ downside then then buy or sell levels appear on Chart ( Automatically show when price reach any reversal zone of harmonic projection pattern based .
After showing reversal levels wait for confirmation until 21.4% or 28.3 % level not break if break then exit from current buy / sell trade and take fresh reverse trade buy/ sell .
Trailing SL:
After reach 1st Target trail SL to just above or below cost ( for example we are holding sell trade from 100 1st Target 110 hit then move trailing sl to 104-105 and move SL as price move upside or Downside)
Re- Entry :
For Re-entry in any pull back Point D ( 11.4% ) is used for re-entry then SL recent high or low Point SL ( 0% ) .
Blue Line is 1st support/ Resistance
Green line is 2nd support/ resistance
Red line is 3rd Support/ resistance

Gold booked 2700 points profit bought at 85950 booked at 88650How to take trades using Harmonic pattern projection Trade setup is explained below :-
Entry : 1st SL point : 0% is recent top or bottom.
Trailing D: 11.4% is work as trailing SL of buy or sell trade if hit then we have to book profit
.If price goes below 2nd D 21.4% to 23.6% range then early traders can make fresh reversals trade after breaking 1st D 11.4% safe traders can reversal trade after breaking Point D 21.4% to 23.6% range
Targets :
Target T1 : 35.1% to 38.3%
Target T3 : 49.1% to 53.2%
T3: 60.9% to 64.8% is our 3rd Target since this is reversal zone so must book profit if break then take fresh trade again
Target T4 : 76.4% to 79.7%
Next Targets are 100% , 127.2% ,141.4% and final Target 161.8%.
How to take reversal trade :
If price going upside/ downside then then buy or sell levels appear on Chart ( Automatically show when price reach any reversal zone of harmonic projection pattern based .
After showing reversal levels wait for confirmation until 21.4% or 28.3 % level not break if break then exit from current buy / sell trade and take fresh reverse trade buy/ sell .
Trailing SL:
After reach 1st Target trail SL to just above or below cost ( for example we are holding sell trade from 100 1st Target 110 hit then move trailing sl to 104-105 and move SL as price move upside or Downside)
Re- Entry :
For Re-entry in any pull back Point D ( 11.4% ) is used for re-entry then SL recent high or low Point SL ( 0% ) .
Blue Line is 1st support/ Resistance
Green line is 2nd support/ resistance
Red line is 3rd Support/ resistance

Gold - Long Term Elliot Wave Counts - Top is near!Gold has finally started it's last leg up, 5th of 5th on Weekly.
This can go another 3-5% to 90600, 9100 or so, or maybe slightly higher, however, when it ends, we are looking for a sharp fall, as an extended 5th with short retracement in 4th doesn't end well.
Lot of people would be trapped, and when it starts breaking levels it will create double pressure from bears shorting and bulls covering longs.
I am expecting around 75k.

Gold Futures: Breaking New Highs During Market UncertaintyTechnical Analysis :
Gold prices have been experiencing a consistent uptrend for the past few months, attracting significant investor interest in both physical and virtual gold. Analyzing the gold futures chart since 2016, we observe a steady pattern of higher lows, confirming a strong bullish trend.
From 2020 to 2023, gold faced a strong resistance at the ₹55,000-₹56,000 zone multiple times, acting as a key barrier. This level was tested in 2020, 2022, and 2023 before finally being taken out in March 2023. Post-breakout, this zone flipped into support, leading to a rally towards ₹61,000-₹62,000, which then acted as the next resistance. After multiple tests, the resistance at ₹61,000-₹62,000 was broken in November 2023, turning into strong support by December 2023.
Gold's steady rise in 2024 led to new all-time highs at ₹65,000 in March 2024 and later at ₹73,500-₹75,000. This resistance was tested six times before finally breaking in September 2024, again flipping into support. Post this breakout, gold surged to ₹79,000-₹80,000 in October 2025, which acted as resistance before being broken in January 2025.
In March 2025, gold futures reached a strong resistance level of ₹86,300-₹86,600, tested multiple times. For two months (February and March 2025), this zone was a key resistance, with the ₹84,000-₹84,500 zone acting as support. Finally, on March 12, 2025, the ₹86,300-₹86,600 resistance was broken, turning into support by March 13, 2025. Subsequently, gold created a new all-time high on March 14, 2025. After consolidating for two days, gold surged again and is now trading near ₹84,500 levels.
Historically, previous resistance zones have turned into support, offering attractive investment opportunities. Moving forward, traders and investors should monitor these key support and resistance levels. If gold continues its uptrend, we may see new resistance levels at ₹90,000, ₹91,000, and ₹92,000, acting as psychological barriers. Conversely, any correction could see previous supports playing a crucial role.
Fundamental Analysis:
Gold Futures price in India have reached an all-time high of approximately ₹88,500 as of March 18, 2025, reflecting a strong upward trend. This surge is attributed to several key factors:
Global Economic Concerns: Recent U.S. tariffs imposed by President Donald Trump have raised fears of economic instability and inflation, prompting investors to flock to gold as a safe-haven asset.
Central Bank Accumulation: Major central banks worldwide are increasing their gold reserves as a hedge against currency fluctuations and economic downturns.
Strong Historical Performance: Over the last decade, gold prices have risen significantly, climbing from ₹29,600 in 2013 to ₹88,500 in 2025.
Inflation: Gold is traditionally considered a hedge against inflation. When inflation rises, the purchasing power of currencies decreases, and gold tends to retain its value.
Currency Fluctuations: The value of the US dollar plays a significant role in gold prices. When the dollar weakens, gold becomes relatively cheaper for investors using other currencies, leading to increased demand.
Indian Cultural Factors: In India, gold has significant cultural and traditional value. Demand for gold surges during festive seasons like Diwali and during wedding seasons, further contributing to price increases.
Interest Rates: When interest rates are low, gold tends to be more attractive as an investment, as holding gold does not provide interest, so low interest rates reduce the opportunity cost of holding gold.
In summary, a combination of global economic factors, financial market dynamics, and specific cultural aspects in India contribute to the rising gold prices.
Impact on Related Stocks:
Several companies are benefiting from the rise in gold prices, including:
Titan Company (owner of Tanishq) – a leading jewelry retailer.
Muthoot Finance – a major gold loan provider.
PC Jeweller – a fast-growing jewelry company.
These companies are likely to see higher profit margins and revenue growth as demand for gold remains strong.
Investment Considerations
Investing in gold comes with both advantages and risks:
✅ Pros:
Acts as a store of value during economic uncertainty.
Serves as a hedge against inflation.
Provides portfolio diversification.
❌ Cons:
Limited short-term gains.
Price volatility.
No passive income (unlike stocks paying dividends).
Investment Options
Investors can gain exposure to gold through multiple avenues:
Physical gold – Traditional form, but involves storage and security concerns.
Gold ETFs – Easy liquidity and lower costs.
Sovereign Gold Bonds (SGBs) – Backed by the government and offer interest income.
Gold stocks – Investing in gold-related companies.
Conclusion
Gold's strong performance and recent all-time highs highlight its importance as a hedge against global uncertainties. Investors should watch key support and resistance levels, as well as global economic trends, before making investment decisions. A balanced strategy aligned with financial goals and risk tolerance will be crucial for maximizing returns in gold investments.
Disclaimer: This analysis is for educational purposes only. Investors should conduct their own research before making any trading decisions.

GOLDHello & welcome to this analysis
A bearish Harmonic Deep Crab formation took place in the 60m time frame, after an initial dip which formed bullish hidden RSI divergence in 60m time frame the pullback has now formed a bearish Harmonic Gartley in 15m time frame.
Sustaining below 88000 opens for 87500 and 86500.
Good risk reward set up for a bearish trade.
All the best

Safe Heaven = GOLDCMP 2922
Minor Retracement till 2950 is possible
Then
a Bounce till 3095 on Cards
For more Technical details - Have a look at the posted Chart
if you like this idea 💡 --- Plz don't miss to Boost 🚀
For more info - Plz visit my profile & Follow me
Rgds,
Naresh G
SEBI Reg.RA

Gold mcx as said earlier until 87300 not break buy on dip suportHow to take trades using Harmonic pattern projection Trade setup is explained below :-
Entry : 1st SL point : 0% is recent top or bottom.
Trailing D: 11.4% is work as trailing SL of buy or sell trade if hit then we have to book profit
.If price goes below 2nd D 21.4% to 23.6% range then early traders can make fresh reversals trade after breaking 1st D 11.4% safe traders can reversal trade after breaking Point D 21.4% to 23.6% range
Targets :
Target T1 : 35.1% to 38.3%
Target T3 : 49.1% to 53.2%
T3: 60.9% to 64.8% is our 3rd Target since this is reversal zone so must book profit if break then take fresh trade again
Target T4 : 76.4% to 79.7%
Next Targets are 100% , 127.2% ,141.4% and final Target 161.8%.
How to take reversal trade :
If price going upside/ downside then then buy or sell levels appear on Chart ( Automatically show when price reach any reversal zone of harmonic projection pattern based .
After showing reversal levels wait for confirmation until 21.4% or 28.3 % level not break if break then exit from current buy / sell trade and take fresh reverse trade buy/ sell .
Trailing SL:
After reach 1st Target trail SL to just above or below cost ( for example we are holding sell trade from 100 1st Target 110 hit then move trailing sl to 104-105 and move SL as price move upside or Downside)
Re- Entry :
For Re-entry in any pull back Point D ( 11.4% ) is used for re-entry then SL recent high or low Point SL ( 0% ) .
Blue Line is 1st support/ Resistance
Green line is 2nd support/ resistance
Red line is 3rd Support/ resistance

Gold prices fell slightly before the Fed's interest rate decisioGold prices fell slightly before the Fed's interest rate decision, waiting for a direction choice
Details>>

Gold mcx updated levels until 87300 not break uptrend continue How to take trades using Harmonic pattern projection Trade setup is explained below :-
Entry : 1st SL point : 0% is recent top or bottom.
Trailing D: 11.4% is work as trailing SL of buy or sell trade if hit then we have to book profit
.If price goes below 2nd D 21.4% to 23.6% range then early traders can make fresh reversals trade after breaking 1st D 11.4% safe traders can reversal trade after breaking Point D 21.4% to 23.6% range
Targets :
Target T1 : 35.1% to 38.3%
Target T3 : 49.1% to 53.2%
T3: 60.9% to 64.8% is our 3rd Target since this is reversal zone so must book profit if break then take fresh trade again
Target T4 : 76.4% to 79.7%
Next Targets are 100% , 127.2% ,141.4% and final Target 161.8%.
How to take reversal trade :
If price going upside/ downside then then buy or sell levels appear on Chart ( Automatically show when price reach any reversal zone of harmonic projection pattern based .
After showing reversal levels wait for confirmation until 21.4% or 28.3 % level not break if break then exit from current buy / sell trade and take fresh reverse trade buy/ sell .
Trailing SL:
After reach 1st Target trail SL to just above or below cost ( for example we are holding sell trade from 100 1st Target 110 hit then move trailing sl to 104-105 and move SL as price move upside or Downside)
Re- Entry :
For Re-entry in any pull back Point D ( 11.4% ) is used for re-entry then SL recent high or low Point SL ( 0% ) .
Blue Line is 1st support/ Resistance
Green line is 2nd support/ resistance
Red line is 3rd Support/ resistance
Gold mcx buy given at 854000 profit until 87400 not break uponlyHow to take trades using Harmonic pattern projection Trade setup is explained below :-
Entry : 1st SL point : 0% is recent top or bottom.
Trailing D: 11.4% is work as trailing SL of buy or sell trade if hit then we have to book profit
.If price goes below 2nd D 21.4% to 23.6% range then early traders can make fresh reversals trade after breaking 1st D 11.4% safe traders can reversal trade after breaking Point D 21.4% to 23.6% range
Targets :
Target T1 : 35.1% to 38.3%
Target T3 : 49.1% to 53.2%
T3: 60.9% to 64.8% is our 3rd Target since this is reversal zone so must book profit if break then take fresh trade again
Target T4 : 76.4% to 79.7%
Next Targets are 100% , 127.2% ,141.4% and final Target 161.8%.
How to take reversal trade :
If price going upside/ downside then then buy or sell levels appear on Chart ( Automatically show when price reach any reversal zone of harmonic projection pattern based .
After showing reversal levels wait for confirmation until 21.4% or 28.3 % level not break if break then exit from current buy / sell trade and take fresh reverse trade buy/ sell .
Trailing SL:
After reach 1st Target trail SL to just above or below cost ( for example we are holding sell trade from 100 1st Target 110 hit then move trailing sl to 104-105 and move SL as price move upside or Downside)
Re- Entry :
For Re-entry in any pull back Point D ( 11.4% ) is used for re-entry then SL recent high or low Point SL ( 0% ) .
Blue Line is 1st support/ Resistance
Green line is 2nd support/ resistance
Red line is 3rd Support/ resistance
Gold buy on dip given until 85300 not break upmove will continueHow to take trades using Harmonic pattern projection Trade setup is explained below :-
Entry : 1st SL point : 0% is recent top or bottom.
Trailing D: 11.4% is work as trailing SL of buy or sell trade if hit then we have to book profit
.If price goes below 2nd D 21.4% to 23.6% range then early traders can make fresh reversals trade after breaking 1st D 11.4% safe traders can reversal trade after breaking Point D 21.4% to 23.6% range
Targets :
Target T1 : 35.1% to 38.3%
Target T3 : 49.1% to 53.2%
T3: 60.9% to 64.8% is our 3rd Target since this is reversal zone so must book profit if break then take fresh trade again
Target T4 : 76.4% to 79.7%
Next Targets are 100% , 127.2% ,141.4% and final Target 161.8%.
How to take reversal trade :
If price going upside/ downside then then buy or sell levels appear on Chart ( Automatically show when price reach any reversal zone of harmonic projection pattern based .
After showing reversal levels wait for confirmation until 21.4% or 28.3 % level not break if break then exit from current buy / sell trade and take fresh reverse trade buy/ sell .
Trailing SL:
After reach 1st Target trail SL to just above or below cost ( for example we are holding sell trade from 100 1st Target 110 hit then move trailing sl to 104-105 and move SL as price move upside or Downside)
Re- Entry :
For Re-entry in any pull back Point D ( 11.4% ) is used for re-entry then SL recent high or low Point SL ( 0% ) .
Blue Line is 1st support/ Resistance
Green line is 2nd support/ resistance
Red line is 3rd Support/ resistance

Support and resistance levelPrevious 20 candle period according to high and low point support and resistance level in 30 minute candle

Gold april future Key level is 86300
Take multiple resistance at 4 hour candles
Probably more likely to get another pull back

Gold bounce from support area 85300 now at resistance 86250 How to take trades using Harmonic pattern projection Trade setup is explained below :-
Entry : 1st SL point : 0% is recent top or bottom.
Trailing D: 11.4% is work as trailing SL of buy or sell trade if hit then we have to book profit
.If price goes below 2nd D 21.4% to 23.6% range then early traders can make fresh reversals trade after breaking 1st D 11.4% safe traders can reversal trade after breaking Point D 21.4% to 23.6% range
Targets :
Target T1 : 35.1% to 38.3%
Target T3 : 49.1% to 53.2%
T3: 60.9% to 64.8% is our 3rd Target since this is reversal zone so must book profit if break then take fresh trade again
Target T4 : 76.4% to 79.7%
Next Targets are 100% , 127.2% ,141.4% and final Target 161.8%.
How to take reversal trade :
If price going upside/ downside then then buy or sell levels appear on Chart ( Automatically show when price reach any reversal zone of harmonic projection pattern based .
After showing reversal levels wait for confirmation until 21.4% or 28.3 % level not break if break then exit from current buy / sell trade and take fresh reverse trade buy/ sell .
Trailing SL:
After reach 1st Target trail SL to just above or below cost ( for example we are holding sell trade from 100 1st Target 110 hit then move trailing sl to 104-105 and move SL as price move upside or Downside)
Re- Entry :
For Re-entry in any pull back Point D ( 11.4% ) is used for re-entry then SL recent high or low Point SL ( 0% ) .
Blue Line is 1st support/ Resistance
Green line is 2nd support/ resistance
Red line is 3rd Support/ resistance

GOLD MCX OUTLOOK FOR MARCH 2025GOLD MCX:
After a smart rally Seen in Gold MCX from 79,600/- levels in JAN 2025 we have seen gold accelerating towards Highs of 86,592/-. Approximately 7,000 Points mammoth rally)
What's Next:
If we analyze the technical chart on daily and weekly time frame. Observed a "Flag Pattern Formation" has been witnessed. If GOLD MCX closes above or sustains above 86400 (Flag Pattern Breakout levels) another leg of rally can be seen on the upside.
Any correction towards 84000-84200 (Flag Pattern Support) it will be best buying opportunity for the short term investors, If Gold MCX closes below 83800 then there can be correction in the yellow metal. So we suggest continue to HOLD long positions with Stop loss of 83800 and accumulate GOLD MCX on correction till 84000- 84200 Levels. (Do not forget the Stop loss)

Gold mcx profit booking started, refer comex chart for levelsHow to take trades using Harmonic pattern projection Trade setup is explained below :-
Entry : 1st SL point : 0% is recent top or bottom.
Trailing D: 11.4% is work as trailing SL of buy or sell trade if hit then we have to book profit
.If price goes below 2nd D 21.4% to 23.6% range then early traders can make fresh reversals trade after breaking 1st D 11.4% safe traders can reversal trade after breaking Point D 21.4% to 23.6% range
Targets :
Target T1 : 35.1% to 38.3%
Target T3 : 49.1% to 53.2%
T3: 60.9% to 64.8% is our 3rd Target since this is reversal zone so must book profit if break then take fresh trade again
Target T4 : 76.4% to 79.7%
Next Targets are 100% , 127.2% ,141.4% and final Target 161.8%.
How to take reversal trade :
If price going upside/ downside then then buy or sell levels appear on Chart ( Automatically show when price reach any reversal zone of harmonic projection pattern based .
After showing reversal levels wait for confirmation until 21.4% or 28.3 % level not break if break then exit from current buy / sell trade and take fresh reverse trade buy/ sell .
Trailing SL:
After reach 1st Target trail SL to just above or below cost ( for example we are holding sell trade from 100 1st Target 110 hit then move trailing sl to 104-105 and move SL as price move upside or Downside)
Re- Entry :
For Re-entry in any pull back Point D ( 11.4% ) is used for re-entry then SL recent high or low Point SL ( 0% ) .
Blue Line is 1st support/ Resistance
Green line is 2nd support/ resistance
Red line is 3rd Support/ resistance
GOLD SILVER VIEW WEEKNDOur Spot #Gold Range Prediction from 10/03/2025 to 16/03/2025 is as under.
Gold Spot :2838$-2933$
Gold INR : 83700-86500
Our Spot #Silver Range prediction from 10/03/2025 to 16/03/2025 is as under.
Silver Spot: 31.30$-32.91$
Silver INR: 93550-98400
It must be remembered that price of precious metal depends on so many world wide factors like inflation, Fed interest rate, trade barrier, geopolitical tension, demand, supply, bond yield, dollar index , GDP, payroll data, CPI, currency fluctuation, debt ceiling , expected tax & duty changes, other commodity price crude oil etc. etc. and hence there can not be any accurate barometer of predicting precious metal price.
Gold INR has been calculated taking Gold Spot international price and converting the same assuming fixed Indian rupee rate. However, this is not accurate method as change in rupee value to dollar can substantially impact Gold INR price. Pl. note that price of commodity doesn't depend upon performence of company but depend upon performence of world economy, hence it is extremely risky to trade in commodities. Commodities market also become more volatile during contract expiry.
These are not a recommendation for buy or sell. This view is only for educational purpose. You are requested to consult your financial advisor before entering in to any trade.
Last weekend is good profit achieved..
