gold mcx stya blw59930 looks dwn 59828--770++++++ viewsgold mcx stya blw59930 looks dwn 59828--770++++++ views more update stya tuned with us wai whtsup
Gold Petal Futures
Trade ideas

sell gold bwl 59930 tgt 59800-600 sell on risesell gold bwl 59930 tgt 59800-600 sell on rise keep tight sl as per lvl more update stya tuned with us

Gold Bullish Butterfly IdentifiedBullish Butterfly
Buy PRZ - 59282-59338
SL - 50149
Target - 59700/59850/60000

Falling stonesThis time its Gold. If closes below resistance Gold could go till its previous support in Monthly timeframe .

Gold is Looking Buy on Hourly Charts for 2% upsideGold is Buy on Hourly Channel for 2% upside in coming few days.
LTP - 60300
SL - 59700
Targets - 61400+
Risk Reward - 1:2

Gold - Short Trade Follow upFollow up for Gold Short Trade :
Gold if short on my view can trail SL to 2001 OR/AND can book partial profits

sell gold 60150--200 looks dwn 60050 spot blw 1972 dwn sell gold 60150--200 looks dwn 60050 spot blw 1972 dwn sell on rise expect dwn fall 1966-60 today high very crucial for seller

sell gold 59850 forex 1959 loooks dwn fall 59710--1954sell gold 59850 forex 1959 looks dwn fall 59710--1954 yes ell on rsie looks in interday chart

sell gold 59750--800 tgt 59628--55sell gold 59750--800 tgt 59628--55 yes ell on rise sl will be 4th hrs candel high or stya blw 59500 thna more dwn side ---join whtsup or relaxxx for nxt update

Gold Hourly suggest Buy for quick move - next 1 weeks viewGold Hourly Chart is forming W Pattern .... Targets can be 62600 in Next Week With SL 60450. LTP - 61000.
Risk Reward 1:3


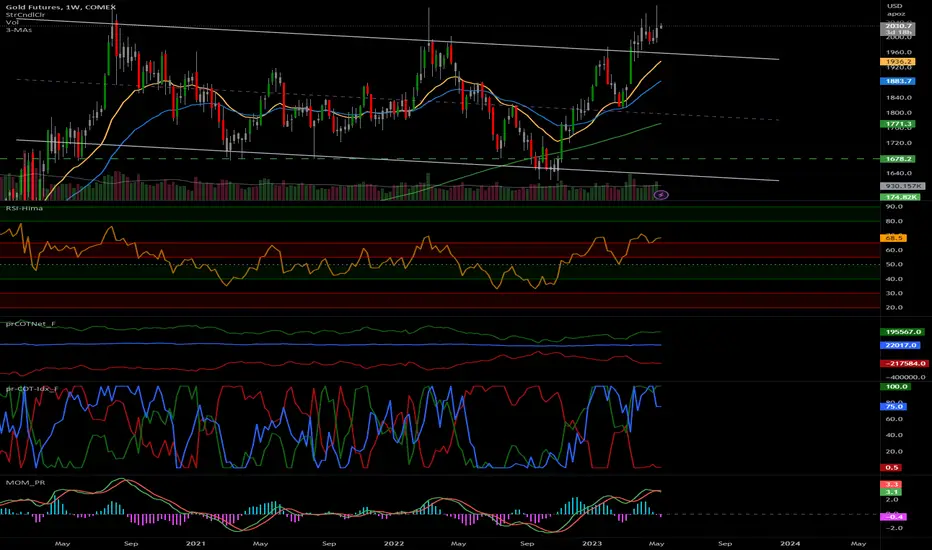
Gold - Probable Short TradeWith Bearish COT Reports AND Weekly momentum down - Gold can be a short between 2030 to 2050 with a stop- of 2091 and a target of 1830-1875. My only concern is positive Daily Momentum. So strictly Stoploss Please
sell gold blw 60050 looks dwn fall 59900-780sell gold blw 60050 looks dwn fall 59900-780 yes looking sharp dwn fall expect gold spot bwl 1975 also dwn expecte looks 1970-65 trade with tight sl more update stya tuned with us wia whtsup

sell gold 60300 expewct dwn sid 60120--59900--60020sell gold 60300 expect dwn sid 60120--59900--60020 yes ell on rise with trendline hurdel 60519 sl more uppdate stya tuned with us wia whtsup

sell gold stya bwl 61050 tgt 60920--850 or mroesell gold stya bwl 61050 tgt 60920--850 or mroe yes sell on rise keep sl or rleaxx stay tumed with us wia whtsup

gold hit 60920 sold gvn 61050 enjoyy more update blwgold hit 60920 sold gvn 61050 enjoyy more update blw-- now eys on eveng time 72500 if stya blw than more dwn fall aheadddddddd

sell gold stay bwl 60920 melted dwn 60780-650 sell gold stay bwl 60920 melted dwn 60780-650 sl for today high hurdel more update stya tuned with us wia whtsup

sell gold stya bwl 60750 looks 628--577 more sell gold stya bwl 60750 -- yes looking sharp dwn fall sell on rise must with today high sl more update stya tuned with us wia whtsup

sell gold stay blw 61222 soon 61100-61000sell gold stay blw 61222 soon 61100-61000 sell or relaxx with hurdel sl more update stya tuned with us wia whtsup

Gold Daily Consolidation can show breakout in upward directionGold Daily is showing strength to break on upside with good ROI in coming days.
Expecting 65000 on Gold in coming months till 59500 is not broken on downside.

Determining trend and consolidation through wave cycles.MCX:GOLD1!
In past, we have discussed how to know the quality of a trend and how to know a chart pattern's extrinsic nature according to the market phase.
If you haven't read that then I want you to read that before to have a better understanding of this idea.
Let's get started!!
How to determine the trend or consolidation through the wave cycles and degrees.
The trend moves in 3 different wave degrees:- For example , think of it like a multi-timeframe analysis.
1. Higher wave cycle (HWC) - This is a 1-month time frame trend.
2. Medium wave cycle (MWC) - This is a 1-day time frame trend.
3. Lower wave cycle (LWC) - This is 30 min time frame trend.
So Without knowing which wave cycle is being traded one can encounter these problems:-
1. Inability to select consistent breakout levels.
2. Inability to select effective stop loss levels.
3. Inability to apply effective stop sizing.
4. Inability to distinguish between trend and consolidation mode.
5. Inability to determine the direction of the predominant trend.
How can we eliminate these complications?
1. Consolidation and Trend Action in Terms of Wave Cycles and Degrees.
A market may be both in trend and consolidation modes at the same time, depending on the wave cycle being observed.
2. We may also define breakouts via the degree of the wave cycles.
Different degrees of waves help in determining whether a breakout will gonna be valid or not as a range formation near the higher wave cycle resistance zone will likely fail.
In the above figure:-
we have breakouts based on waves of lower, medium, and higher degrees. In other words, the breakout level will depend on the wave degree being traded. Being aware of the wave degree being traded will allow the trader to size the stop-loss effectively, according to the average wave amplitude and volatility associated with that particular wave degree.
3. Significance of higher wave degree reversals
When big market trends change direction, it affects smaller trends as well. This is because all the smaller trends are part of the bigger trend. So, when the big trend changes, the smaller trends also change in the same direction. This is important to understand because it means that when you see a change in a big trend, it's a sign that many smaller trends are also changing. However, smaller trends changing doesn't necessarily mean the big trend will change too.
Conclusion:- Always know which wave cycle you are trading and at what point you stand in that wave cycle.
Note: In upcoming Ideas, we will cover how Waves are used in the Elliott Wave concept.
I hope this short idea on trend or consolidation determination has added some knowledge and helped in improving your trading.
please like and comment with your views on this idea.
Keep learning,
Happy trading.
Thank you for reading.

gold spot blw 2004 in ,mcx 60350 dwn only gold spot blw 2004 in ,mcx 60350 dwn only yes sell on riseeeeeeeeeeeeee looks more dwn fall

gold stya bwl 60500 looks mor3 dwn fall 60410-377gold stya bwl 60500 looks mor3 dwn fall 60410-377 yes data negative for gold siulver sell on riseee must hurdel 60790 for sl more stya with us wia whtsup us
