Chart Patterns 🔸 What Are Chart Patterns?
Chart patterns are formed by price movements over time. They represent market structure and help traders anticipate breakouts, breakdowns, or reversals.
🔹 Types of Chart Patterns
1️⃣ Reversal Chart Patterns
2️⃣ Continuation Chart Patterns
3️⃣ Neutral Chart Patterns
4
BANKNIFTY INDEX FUTURES
No trades
Related futures

Part 1 Support and Resistance Put Option Explained
A Put Option gives the buyer the right to sell the underlying asset at a fixed price before or on expiry.
Example:
If NIFTY is trading at 22,000 and you buy a 21,800 Put Option, you expect the market to move down.
If NIFTY falls to 21,500 → You profit
If NIFTY stays above 2

Best Knowledge Of Candle Patterns Single-Candle Patterns
1. Doji:
A Doji forms when the opening and closing prices are virtually identical, resulting in a very small body. It represents indecision in the market. There are variations, such as the Long-Legged Doji, indicating high volatility with indecision, and the Gravestone Doji,

Energy Trading in the Era of GeopoliticsPower, Strategy, and Global Influence
Energy trading has always been a vital component of the global economy, but in the modern era, it has become inseparably linked with geopolitics. Oil, natural gas, coal, uranium, and increasingly renewable energy resources are no longer just commodities exchang

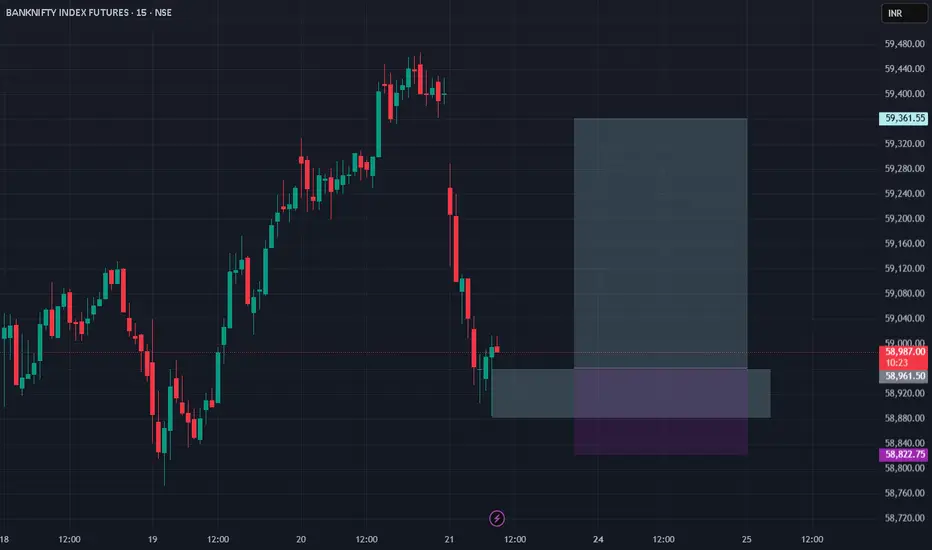
Did BANKNIFTY Just Print a Regime Candle? Why NOT NIFTY?
While we are celebrating all-time highs (ATH), something peculiar happened right at the open in BANKNIFTY.
Look at the first abnormally large candle on BANKNIFTY futures (across time frames). That move wasn’t normal range expansion. And it wasn’t just a breakout either.
It had the signature of a r

Daily Macro, Market Mood Swings, and the Stories Behind the NoisGlobal Markets: Three’s a Trend
Global stocks pushed higher for a third straight session on Tuesday, fueled by growing confidence that the Federal Reserve will slip in a December rate cut like an early holiday present. U.S. Treasury yields eased as well, giving investors one more reason to feel opt

BNF long 15 minute scalp study on this scenario for bank nifty. check it out. price gave impulsive reaction from demand zone
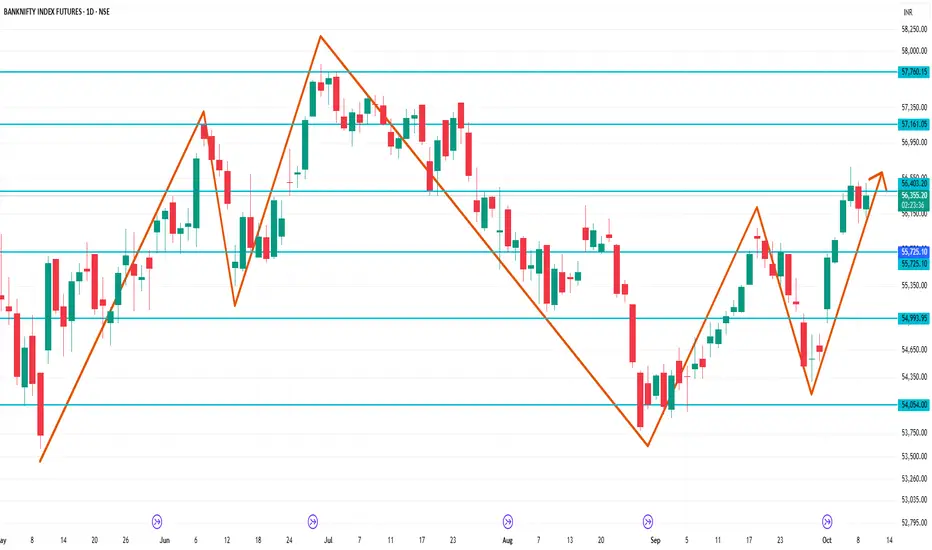
BankNifty 1 Day Time Frame 📊 1-Day Timeframe Technical Analysis
Current Price: ₹56,204.60
Day's Range: ₹55,843.90 – ₹56,286.25
52-Week Range: ₹47,702.90 – ₹57,628.40
Year-to-Date Return: +10.39%
1-Month Return: +3.56%
🔧 Technical Indicators
Trend: Neutral
Resistance Levels: ₹56,230 (immediate), ₹56,600 (stronger)
Support Lev
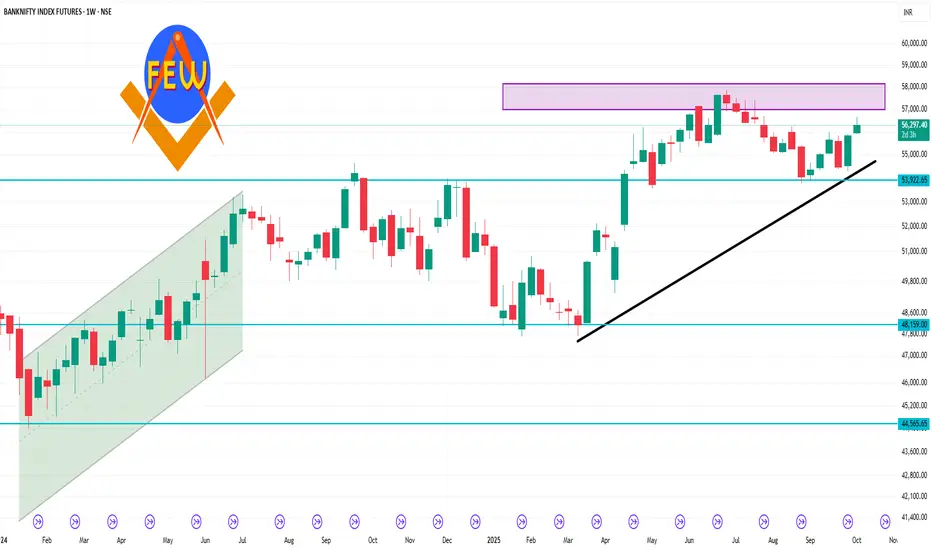
Banknifty 1 Week Time Frame 📊 Current Technical Snapshot
Spot Level: Approximately 55,900
Trend: Neutral to slightly bullish
Support Levels: 55,531; 55,778; 56,009
Resistance Levels: 56,486; 56,733; 56,964
🔍 Key Observations
Consolidation Zone: The Bank Nifty is trading within a defined range, with immediate support near 55,
Part 1 Master Candle Stick Pattern1. Long Call Strategy – Betting on Upside
One of the simplest option strategies is buying a long call. Traders use this when they are bullish but want to risk less capital than buying the stock outright.
Maximum Loss: Limited to premium paid.
Maximum Profit: Unlimited (stock can theoretically ris

See all ideas
Summarizing what the indicators are suggesting.
Neutral
SellBuy
Strong sellStrong buy
Strong sellSellNeutralBuyStrong buy
Neutral
SellBuy
Strong sellStrong buy
Strong sellSellNeutralBuyStrong buy
Neutral
SellBuy
Strong sellStrong buy
Strong sellSellNeutralBuyStrong buy
A representation of what an asset is worth today and what the market thinks it will be worth in the future.
Displays a symbol's price movements over previous years to identify recurring trends.
Frequently Asked Questions
The current price of BANKNIFTY INDEX FUTURES is 59,678.00 INR — it has risen 0.03% in the past 24 hours. Watch BANKNIFTY INDEX FUTURES price in more detail on the chart.
The volume of BANKNIFTY INDEX FUTURES is 694.05 K. Track more important stats on the BANKNIFTY INDEX FUTURES chart.
Open interest is the number of contracts held by traders in active positions — they're not closed or expired. For BANKNIFTY INDEX FUTURES this number is 1.71 M. You can use it to track a prevailing market trend and adjust your own strategy: declining open interest for BANKNIFTY INDEX FUTURES shows that traders are closing their positions, which means a weakening trend.
Buying or selling futures contracts depends on many factors: season, underlying commodity, your own trading strategy. So mostly it's up to you, but if you look for some certain calculations to take into account, you can study technical analysis for BANKNIFTY INDEX FUTURES. Today its technical rating is buy, but remember that market conditions change all the time, so it's always crucial to do your own research. See more of BANKNIFTY INDEX FUTURES technicals for a more comprehensive analysis.