AccumulationIGL stock is in good accumulation and descending triangle pattern formed and trying to recover from crucial support. Please consult your financial advisor before investing.
Cmp is 458.85
best discount price to buy 454.7
Target 1: 483.55
Target 2: 504
Target 3: 537.05
IGL trade ideas

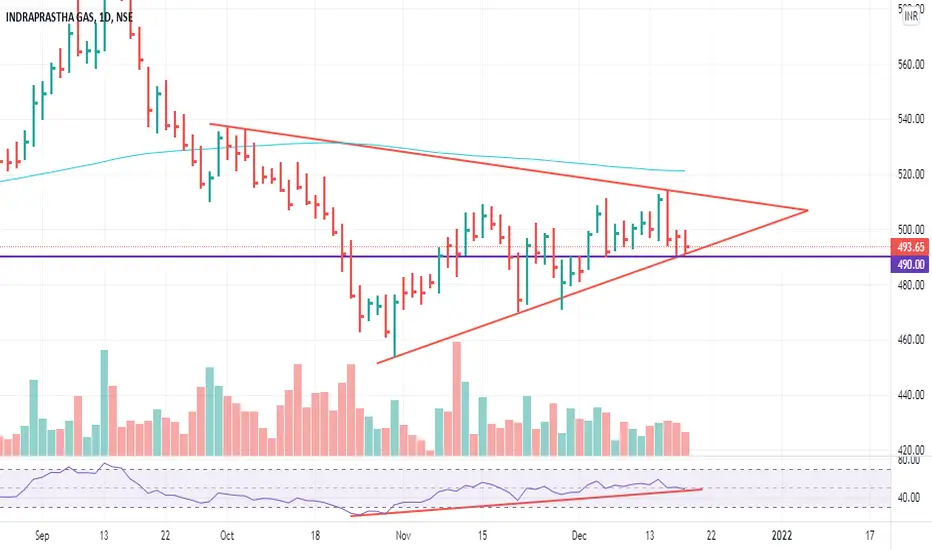
POWER OF MAJOR + HORIZONTAL SUPPORT !IGL is near its very important major support trend line. Also it is on its horizontal support line. The combination of these two supports can acts as very crucial support.
Enter on break of minor trend line that is drawn. This is very goog R:R trade.
This analysis was done by me only for understanding work of trend line. Use this only for education.
Feel free to share your views/feedbacks.

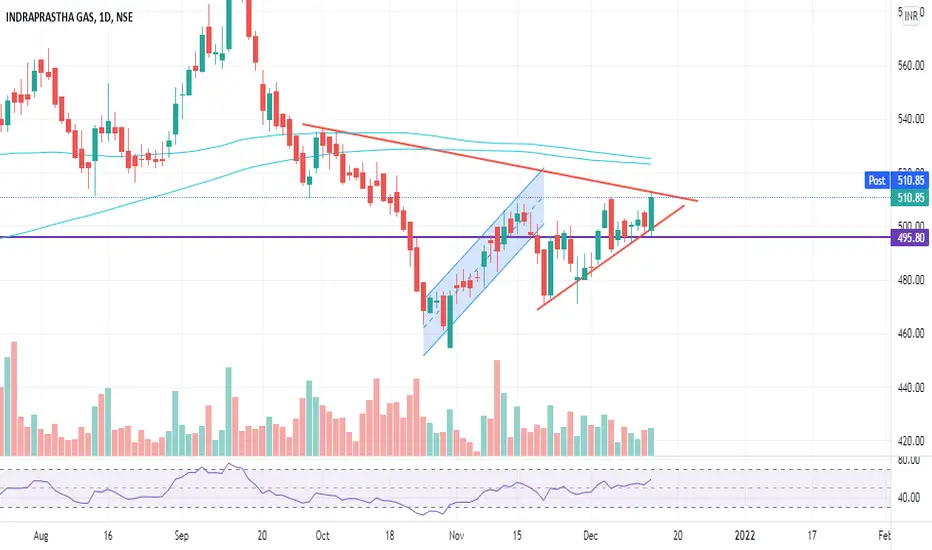
IGL long term positional ViewTrading near Lower trend Line, If sustain above the trend line then go long. This is for Educational Purpose only, apply your prudence & consult your adviser before trade.

Igl show weekness shartMy view on Igl chart
Igl start correction 14 sep 2021 and first lag complete 29 oct 2021 type of part 5 wave
igl start second lag 30 oct 2021 second lag complete 15 dec 2021
c wave start 16 dec 2021 c wave 5 lag hona chaiya
Note -
One of the best forms of Price Action is to not try to predict at all. Instead of that, ACT on the price. So, this chart tells at "where" to act in "what direction. Unless it triggers, like, let's say the candle doesn't break the level which says "Buy if it breaks", You should not buy at all.
=======
I use short hands for my trades.
"Positional" - means You can carry these positions and I do not see sharp volatility ahead. (I tally upcoming events and many small kinds of stuff to my own tiny capacity.)
"Intraday" -means You must close this position at any cost by the end of the day.
"Theta" , "Bounce" , "3BB" or "Entropy" - My own systems.
=======
I won't personally follow any rules. If I "think" (It is never gut feel. It is always some reason.) the trade is wrong, I may take reverse trade. I may carry forward an intraday position. What is meant here - You shouldn't follow me because I may miss updating. You should follow the system I share.
=======
Like -
Always follow a stop loss.
In the case of Intraday trades, it is mostly the "Day's High".
In the case of Positional trades, it is mostly the previous swings.
I do not use Stop Loss most of the time. But I manage my risk with options as I do most of the trades using derivatives.
=======

Indraprastha Gas Cmp 465 dated 6.1.2022 Bottom Out BUYIndraprastha Gas Cmp 465 dated 6.1.2022
1. Tripple Bottom made
2. Price rise with Volumes
3. RSI Reversal.
Buy for a tgt of 480-490-500 SL 455
It is just a view, pls trade at your own risk.

IGLWait And Watch ??
Look for Low risk, High reward, and High Probability setups-
Things to Remember while Trading with the Trend
1. Know what the trend is.
2. The best trades are made in the direction of the trend.
3. Assume that the main trendline or moving average will hold.
4. The longer the moving average is, the better it defines the trend.
5. Wait for the pullback.
6. Don’t chase the market.
7. Don’t fight the market.
8. Even in the strongest trends there should be some retracement.
9. The closer the market is to the trendline, the better the risk/reward ratio is.
10. Use ADX to determine the strength of the trend.
11. Higher the level of ADX , the stronger the trend, below 20 consider the market to be choppy
12. Hold trades longer in a strong trend.
13. Wait for confirmation of a trendline breaking before reversing position.
14. Know where the Support levels are.
15. Place stops outside the Support levels.
Thank You..

IGL -- At Crucial Levels -- Very High Risk Reward Ratio Can go long here with small sl of 440 for the targets of 600+
Do your own study.

Futures and Equity trade-IGLStoploss-499.
Equity ride until it break previous candle low and Long futures with 50-60 points.

INDIRAPRASATH GASINDIRAPRASATH GAS
ABOVE 492
TARGET 500,505,510,513
Below 490
Target 480,472
Don't miss that call


At Trend Line Support!At Trend Line Support. If manages to stay above 490, we may again see 510+ levels on Monday. However, if that's breached and sustained, stock may fall to sub 460 levels.

POSSIBLE BREAKOUT CANDIDATE!Stock has made a strong base at 495-496. Keeping this as SL, watch out above today's high for tomorrow's trading. 535+ looking highly likely.
Ascending Triangle IGLAscending Triangle formation in IGL
Buy only at Breakout or at re-test
Target :-558

IGL TECHNICAL VIEW COMING WEEK level 490- 528Igl 4 hr timeframe sustaining 512 close breakout we expect 528,545 levels.volatility level 495 -505.key point above 505 target 512.below 495 target 490.strong support 490.strong resistance 510.so volume deciding factor sustain above 512 level.


IGL Medium Term View Target 700Buy intermittently within accumulation zone. Levels provided in Chart

LONG IGLgood for short term swing trade my next to investt on this please suggest me it is good are not

Watchout IGL--Trendline BreakoutTrendline breakout in IGL.
Can go long for a small target of Rs 223 for swing trade.
This is my own analysis and for educational purpose only.

IGL | 515 | 540 | INTRADAY+SWING WEEKLY TRADE 8%+NSE:IGL
Trade Logic | PULLBACK BUY LOW RISK TRADE. OR BUY BREAKOUTS. CONFIRMED.
Entry 502
Stop 470 -6% INTRA LEVELS ON CHAT
Target 1 512 | 540 +8%
RR 1.2+ 2nd Target
Details on chart as always
1 free trade idea daily.
Trade Size 2% Max
Max Trades 20/ Month
Time Frame 1 DAY 1 WEEK
Diversify Bet Small Lose less. | Our Motto.
#TRADEWORLD | #MARKET_MAGIC
TEST FIRST / TRADE LATER


IGL- Short term callSmall trend breakout, buy while retesting the consolidation zone 490-493. Keeping strict SL @ 470 on closing basis.
Targets:- 515, 520, 525

IGL - Buy, SL - 479IGL looks bullish on chart, about to provide a trend line breakout. Maintain strict stop loss.
Disclaimer : Do your due diligence before investing.
