IGL trade ideas

IGL Elliott Wave Theory PerspectiveDo not ever Forget the content on all of our analysis are subject to change at any time without notice, and is provided for the sole purpose of assisting traders to make independent investment decisions.
Nothing on this video constitutes a personal recommendation. Seek independent financial advice from licensed professionals If you need it.
Please support us to help more people..


[Buddha] IGL Inside Bar TradeLong if it breaks the high of the previous day with a stop loss at the previous day's low.
Short if it breaks the low of the previous day with a stop loss at the previous day's high.
In case of gap up above the previous day's high or gap down below the previous day's low, please avoid buying it or selling it respectively. Follow the ending of the candle formed in first 5 minutes and follow ORB strategy.


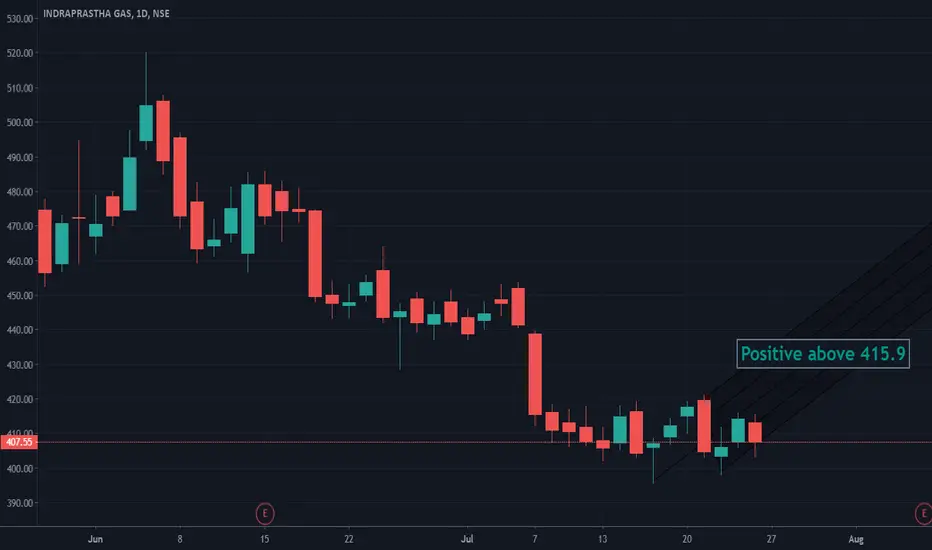
IGL - INSIDE BAR PATTERN#IGL
BUY ABOVE 410
SL TRENDLINE + BUFFER
TGT 411.5/ 414.5/ 417.5
SELL BELOW TRENDLINE
SL 410
TGT 398.3/ 395.8/ 393.4


Indraprastha Gas Ltd. - WEEKLY CHART!!!Indraprastha Gas Ltd. trading right at weekly support zone. Likely to see bounce in the stock until support zone of 395-400 is protected on the downside. Technical parameters looks neutral as of now. Keep a watch.


Indraprastha Gas Ltd LONG !Indraprastha Gas Ltd chart looks good and successfully hold the support level at 400 . one can start buying at current level for short term target 420-450/- and long term
target 520/-


IGL - Long on breaking upside - PositionalIGL has broken slow out of a descending wedge. The stock has had a considerable fall after recovering beautifully post COVID. Now, it seems like the stock has slowly begun it's up move again
The Stock has consistently followed pattern breakouts/breakdowns prior to this. (As shown in the chart).
See a long above 420 (safer 425) for the next Fibonacci targets (all mentioned on the chart for you all)

IGL at strongest resistance,wait for closure above resistanceIGL at strongest resistance,wait for closure above resistance


