IGL trade ideas


How to understand its a correction or Reversal Using tools Funny People , crazy people , simply follow some theory which do not work , I see a simple use of Pitchfork is understand the deviation form its peak difference but one person seems using it like a trend line , You can view his charts , he always uses it wrong and post charts which eventually fail to move or make to forecast
Here you can learn step by step read this message and check the chart
01) Main Trend form Monthly its down ward
02) It has made and strong pull back at 1st place and then failed to hold and continued down ward by giving and L type leg
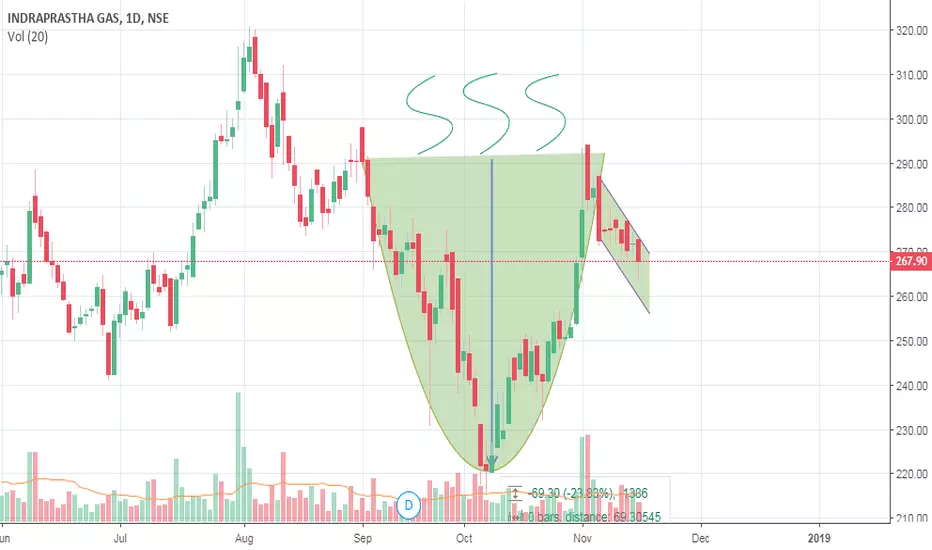
03) I have market 1st peak down( 28 June 2018) where the MACD showed the divergence for up side and it went up very strong looks like impulse
04) When it broke its point of impulse low and continued we understood its an push up before continuation of the trend , Now again its pushing up (8 Oct 2018)
05) This time its pushing weak price action , and there is no Momentum strength to say its going to reverse now , its deep down ward
06) It made move up and came down but it made Higher High , Giving us an Divergence up side in the Momentum , but there is problem , the problem is the Price range is too low to consider its moving up side as impulse so we identified it as Corrective structure for one more move down , and we are trading based on our trading principal
I hope you will understand how to identify on real time and take proper decision
Another part is Using of Pitchfork , its designed to identify the price deviation form its peak angle , it was believed its an alternate tool form BB without volume calculations in it
Hope you Guys have understood and take better trade in case find any such difference in the Momentum and use the Pitchfork correctly
Good Luck


Neutral stand , No trading This one is in Fish Market , crawling up very narrow range and it might brake down but its not a Good trade to take any interim structure , one can wait for it to make double top and reverse for short selling in Futures

IGL - Inside Bar Trade IdeaLong above 276.3 with SL 271.8
T1 277.75
T2 279.6
T3 281.8
T4 284.9
Short below 271.8 with SL 276.3
T1 270.35
T2 268.9
T3 267.4
T4 265.55


IGL - Channel.Moving In Channel.
Buy In Demand Zone As Per Comfort.
Risk Reward Favourable.
Other Details Mentioned In Chart.
Positional View For Educational Purpose Only.
Please Consult Your Financial Advisor Before Taking Any Decision.
I am not SEBI Registered Financial Advisor.


Double inside bar IGLLong at PDH if, PDH is broken with SL at PDL
Short at PDL if, PDL is broken with SL at PDH
PDH - 268.45
PDL - 264.6


Inside bar IGLLong at PDH if, PDH is broken with SL at PDL
Short at PDL if, PDL is broken with SL at PDH
PDL - 269.2
PDH - 274.5

