How to Add and Select Weekly time frame stocks on Trading view I make educational content videos for swing / positional trading
Next report date
—
Report period
—
EPS estimate
—
Revenue estimate
—
18.95 INR
22.62 B INR
186.11 B INR
644.03 M
About Mahindra & Mahindra Financial Services Ltd.
Sector
Industry
CEO
Raul Rebello
Website
Headquarters
Mumbai
Founded
1991
ISIN
INE774D01024
FIGI
BBG000R0GZH6
IPO date
Feb 21, 2006
IPO offer price
4.51 USD
Mahindra & Mahindra Financial Services Ltd. is a non-banking financial company, which engages in the provision of asset finance in the rural and semi-urban areas in India. It offers financing for auto and utility vehicles, tractors, cars, commercial vehicles and construction equipment, and pre owned and others vehicles to transport operators, farmers, small businesses and self-employed and salaried individuals, personal Loans for weddings, children's education, medical treatment, and working capital for a small or medium-sized enterprise, and project finance, equipment finance, working capital finance, vehicle finance, and bill discounting services to small and medium-sized enterprises. The firm also provides life, non-life, and reinsurance products, housing finance, equity mutual funds, tax saver mutual funds, monthly income funds, and other investment products, and investments and advisory services. The company was founded on January 1, 1991 and is headquartered in Mumbai, India.
Related stocks

M&M FIN SAILING IN BLUE SKY ZONEBUY M&M FINANCE 355 for 380 to 410 levels.
Technical breakout to all time high zones with volumes.
View invalid if falls below 325 on weekly closing.


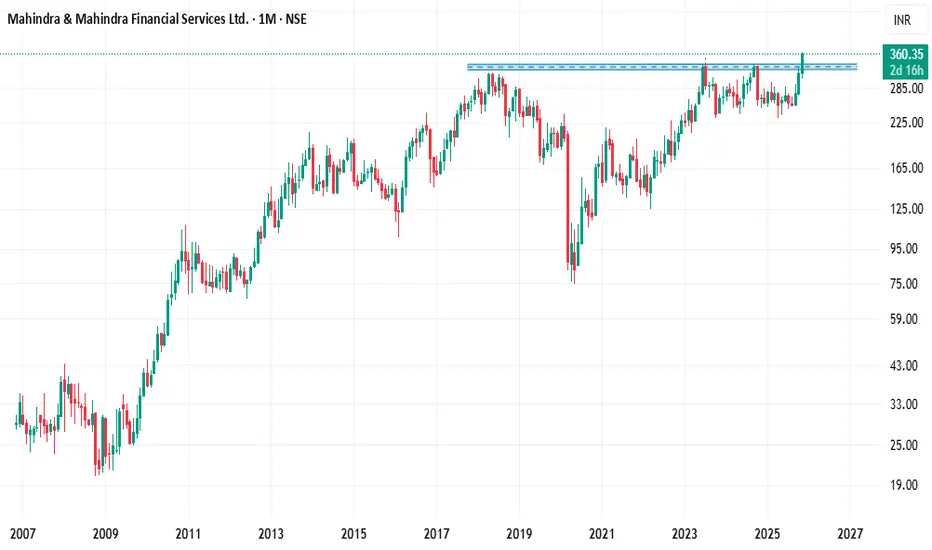
M&MFIN_on Monthly Timeframe📈 Technical Analysis (Monthly)
1️⃣ Long-Term Structure (2007–2025)
The stock shows a multi-year secular uptrend with large consolidation phases:
2007–2010: Long accumulation phase at low levels
2010–2018: Strong trending move → major impulse to ~₹500
2018–2020: Deep correction & COVID crash
20
M&M Finance: Bullish Outlook with 20%+ Upside Potential
🏦 Technical Snapshot
🔺 Breakout Zone: ₹337–₹342 (3D close above multi-quarter resistance)
🔺 Major Target: ₹400 (historical supply - measured move)
🔻 Key Support: ₹313 (prior resistance flipped; risk management line)
📈 RSI: 75.7 (strong momentum, slightly overbought but no reversal)
📉 Patte

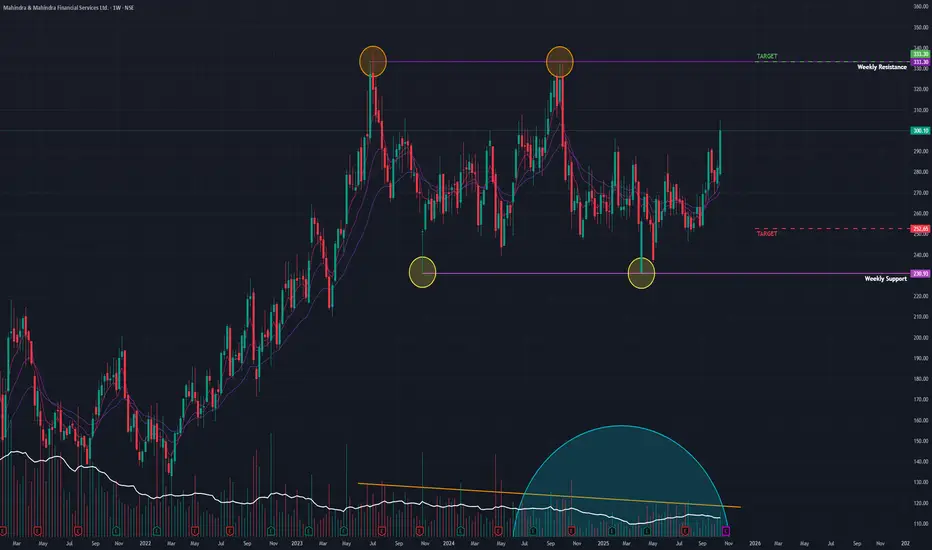
M&M Fin (W): Bullish, Breakout with Short-Term Rejection(Timeframe: Weekly | Scale: Logarithmic)
The stock has confirmed a major multi-year breakout, moving into "Blue Sky" territory. However, the daily price action suggests a temporary pullback (re-test) is imminent before the uptrend resumes.
📈 1. The Breakout Structure (The "Big Picture")
- The
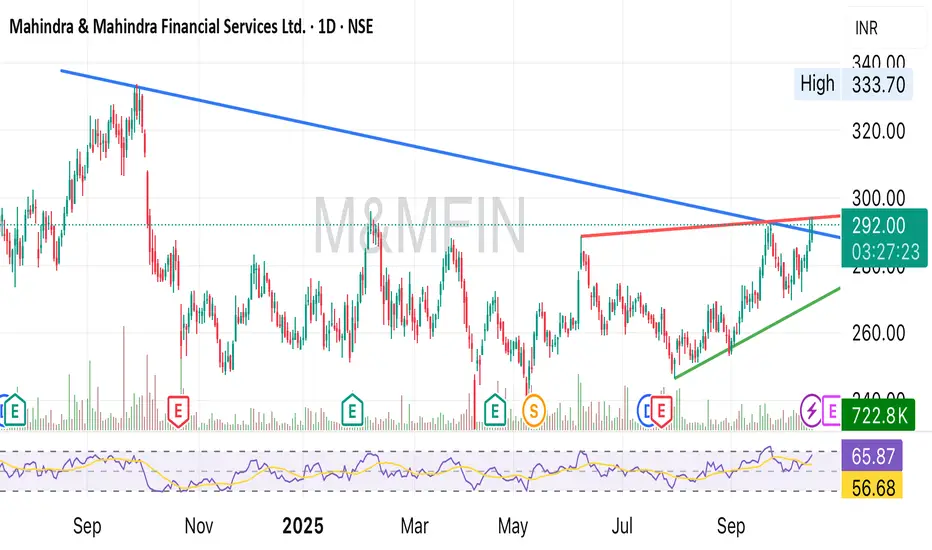
M&M FinanceClean breakout with 3 rejections at the upper trendline on daily chart. Took an entry at 331 post-confirmation with SL near 320.

More room on the upsideM&M Fin CMP 322.90
Elliott- This is the last impulse wave in action. The target for the same is at 380. Taking 380 as tgt when we draw the fibs it has nailed the highs. Hence we have a a high prob tgt at 380

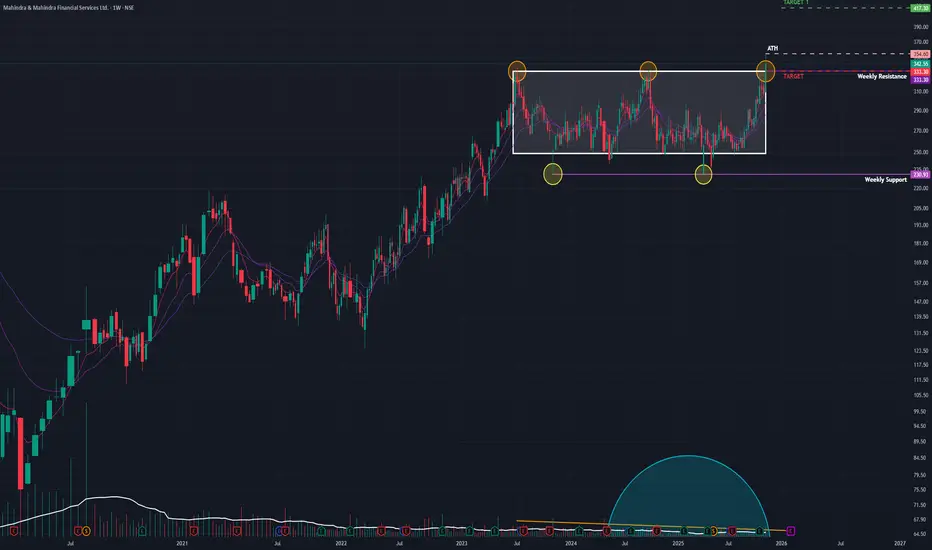
M&M Fin (W) - Renewed Strength within a Multi-Year ConsolidationAfter more than two years of trading in a sideways range, M&M Financial Services is showing strong signs of renewed buyer interest, suggesting a potential move towards the top of its long-term consolidation channel.
The Big Picture: A Prolonged Consolidation
Since reaching its All-Time High (AT
Mahindra & Mahindra Financial Bullish view Mahindra & Mahindra Financial bullish
Trendline breakout since October 2024
Also Near the short term trendline breakout.
See all ideas
Summarizing what the indicators are suggesting.
Neutral
SellBuy
Strong sellStrong buy
Strong sellSellNeutralBuyStrong buy
Neutral
SellBuy
Strong sellStrong buy
Strong sellSellNeutralBuyStrong buy
Neutral
SellBuy
Strong sellStrong buy
Strong sellSellNeutralBuyStrong buy
An aggregate view of professional's ratings.
Neutral
SellBuy
Strong sellStrong buy
Strong sellSellNeutralBuyStrong buy
Neutral
SellBuy
Strong sellStrong buy
Strong sellSellNeutralBuyStrong buy
Neutral
SellBuy
Strong sellStrong buy
Strong sellSellNeutralBuyStrong buy
Displays a symbol's price movements over previous years to identify recurring trends.
935MMFSL29
Mahindra & Mahindra Financial Services Ltd. 9.35% 18-JAN-2029Yield to maturity
13.13%
Maturity date
Jan 18, 2029
790MMFSL27
Mahindra & Mahindra Financial Services Ltd. 7.9% 24-JUL-2027Yield to maturity
10.26%
Maturity date
Jul 24, 2027
825MMFS27
Mahindra & Mahindra Financial Services Ltd. 8.25% 25-MAR-2027Yield to maturity
9.91%
Maturity date
Mar 25, 2027
795MMFSL32
Mahindra & Mahindra Financial Services Ltd. 7.95% 24-JUL-2032Yield to maturity
9.53%
Maturity date
Jul 24, 2032
853MMFSL26
Mahindra & Mahindra Financial Services Ltd. 8.53% 06-JUN-2026Yield to maturity
8.52%
Maturity date
Jun 6, 2026
824MMFSL34
Mahindra & Mahindra Financial Services Ltd. 8.24% 06-OCT-2034Yield to maturity
7.95%
Maturity date
Oct 6, 2034
81MMFSL26
Mahindra & Mahindra Financial Services Ltd. 8.1% 21-MAY-2026Yield to maturity
7.90%
Maturity date
May 21, 2026
M
835MRHFL32
Mahindra Rural Housing Finance Ltd. 8.35% 24-SEP-2032Yield to maturity
7.57%
Maturity date
Sep 24, 2032
79MMFSL27
Mahindra & Mahindra Financial Services Ltd. 7.9% 30-AUG-2027Yield to maturity
7.21%
Maturity date
Aug 30, 2027
805MMFSL32
Mahindra & Mahindra Financial Services Ltd. 8.05% 24-JUL-2032Yield to maturity
7.07%
Maturity date
Jul 24, 2032
745MMFSL31
Mahindra & Mahindra Financial Services Ltd. 7.45% 17-NOV-2031Yield to maturity
7.01%
Maturity date
Nov 17, 2031
See all M&MFIN bonds
Frequently Asked Questions
The current price of M&MFIN is 352.00 INR — it has decreased by −4.39% in the past 24 hours. Watch Mahindra & Mahindra Financial Services Ltd. stock price performance more closely on the chart.
Depending on the exchange, the stock ticker may vary. For instance, on NSE exchange Mahindra & Mahindra Financial Services Ltd. stocks are traded under the ticker M&MFIN.
M&MFIN stock has fallen by −6.39% compared to the previous week, the month change is a 12.70% rise, over the last year Mahindra & Mahindra Financial Services Ltd. has showed a 29.93% increase.
We've gathered analysts' opinions on Mahindra & Mahindra Financial Services Ltd. future price: according to them, M&MFIN price has a max estimate of 440.00 INR and a min estimate of 225.00 INR. Watch M&MFIN chart and read a more detailed Mahindra & Mahindra Financial Services Ltd. stock forecast: see what analysts think of Mahindra & Mahindra Financial Services Ltd. and suggest that you do with its stocks.
M&MFIN stock is 2.59% volatile and has beta coefficient of 1.47. Track Mahindra & Mahindra Financial Services Ltd. stock price on the chart and check out the list of the most volatile stocks — is Mahindra & Mahindra Financial Services Ltd. there?
Today Mahindra & Mahindra Financial Services Ltd. has the market capitalization of 510.50 B, it has increased by 3.99% over the last week.
Yes, you can track Mahindra & Mahindra Financial Services Ltd. financials in yearly and quarterly reports right on TradingView.
Mahindra & Mahindra Financial Services Ltd. is going to release the next earnings report on Feb 3, 2026. Keep track of upcoming events with our Earnings Calendar.
M&MFIN earnings for the last quarter are 4.10 INR per share, whereas the estimation was 3.98 INR resulting in a 2.93% surprise. The estimated earnings for the next quarter are 5.68 INR per share. See more details about Mahindra & Mahindra Financial Services Ltd. earnings.
Mahindra & Mahindra Financial Services Ltd. revenue for the last quarter amounts to 24.23 B INR, despite the estimated figure of 22.68 B INR. In the next quarter, revenue is expected to reach 25.81 B INR.
M&MFIN net income for the last quarter is 5.64 B INR, while the quarter before that showed 5.28 B INR of net income which accounts for 6.94% change. Track more Mahindra & Mahindra Financial Services Ltd. financial stats to get the full picture.
Yes, M&MFIN dividends are paid annually. The last dividend per share was 6.50 INR. As of today, Dividend Yield (TTM)% is 1.77%. Tracking Mahindra & Mahindra Financial Services Ltd. dividends might help you take more informed decisions.
Mahindra & Mahindra Financial Services Ltd. dividend yield was 2.36% in 2024, and payout ratio reached 36.47%. The year before the numbers were 2.26% and 40.22% correspondingly. See high-dividend stocks and find more opportunities for your portfolio.
EBITDA measures a company's operating performance, its growth signifies an improvement in the efficiency of a company. Mahindra & Mahindra Financial Services Ltd. EBITDA is 58.40 B INR, and current EBITDA margin is 61.74%. See more stats in Mahindra & Mahindra Financial Services Ltd. financial statements.
Like other stocks, M&MFIN shares are traded on stock exchanges, e.g. Nasdaq, Nyse, Euronext, and the easiest way to buy them is through an online stock broker. To do this, you need to open an account and follow a broker's procedures, then start trading. You can trade Mahindra & Mahindra Financial Services Ltd. stock right from TradingView charts — choose your broker and connect to your account.
Investing in stocks requires a comprehensive research: you should carefully study all the available data, e.g. company's financials, related news, and its technical analysis. So Mahindra & Mahindra Financial Services Ltd. technincal analysis shows the buy rating today, and its 1 week rating is buy. Since market conditions are prone to changes, it's worth looking a bit further into the future — according to the 1 month rating Mahindra & Mahindra Financial Services Ltd. stock shows the buy signal. See more of Mahindra & Mahindra Financial Services Ltd. technicals for a more comprehensive analysis.
If you're still not sure, try looking for inspiration in our curated watchlists.
If you're still not sure, try looking for inspiration in our curated watchlists.