NBCCNBCC 8–12 Month Stock View
📊 NBCC (India) — 8–12 MONTH INVESTMENT VIEW
Buying Zone: ₹78–₹70
Target 1: ₹120 🎯
Target 2: ₹130 🎯
Time Horizon: 8–12 Months
NBCC continues to attract attention on the back of a strong order pipeline and improving profitability. The company entered FY27 with a consolid
NBCC (INDIA) LIMITED
No trades
No trades
Compare with NBCC (INDIA) LIMITED
2.75 INR
7.20 B INR
126.45 B INR
1.03 B
Next report date
—
Report period
—
EPS estimate
—
Revenue estimate
—
Company info
Sector
Industry
CEO
K. P. Mahadevaswamy
Website
Headquarters
New Delhi
Founded
1960
IPO date
Apr 12, 2012
ISIN
INE095N01031
FIGI
BBG001R3V060
Identifiers
ISIN INE095N01031
NBCC (India) Ltd. engages in the real estate development, project management, and consultancy services. It operates through the following segments: Project Management Consultancy (PMC); Real Estate; and Engineering Procurement and Construction (EPC). The PMC segment provides consultancy services to residential, office, commercial and educational institutions, border fencing and infrastructure projects like roads, water supply system, and water storage solutions. The Real Estate segment focuses on residential and commercial projects. The EPC segment aims at high value projects. The company was founded on November 15, 1960 and is headquartered in New Delhi, India.
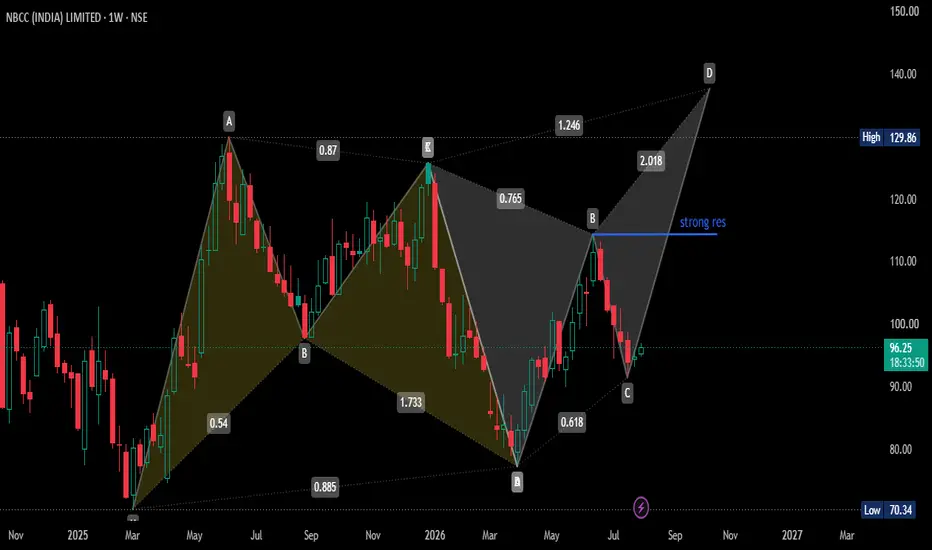
NBCC BAT going to be BUTTERFLYHere this chart is expaining itself The pattern on the right is a Bullish Harmonic / AB=CD Continuation Pattern developing off the ₹80 bottom:
Initial Rebound to B: Following the reversal at ₹80, the price rallied to form peak B near ₹115.
Strong Resistance ("strong res"): The blue horizontal lin
NBCC Looks Interesting – Keep It on Your Watchlist!NBCC is showing signs of strength after a recent correction. It is now approaching an important price level.
✅ My Trading Plan
🟢 Buy only if NBCC closes above ₹95.50.
This will indicate that buyers are taking control.
🎯 Target: ₹100 – ₹101
🛑 Stop Loss: ₹93
Things to Remember
Don't rush into buy
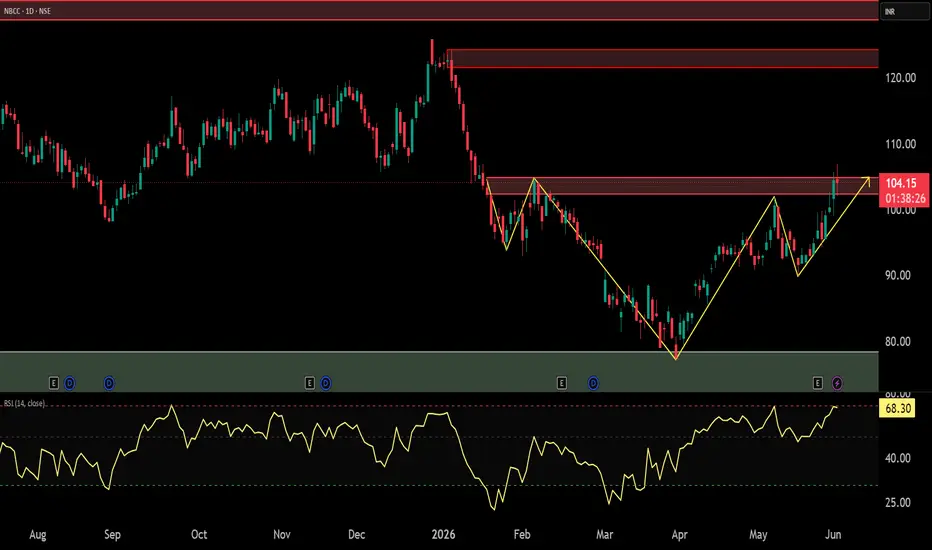
NBCC: Pattern Breakout and Key LevelsThe stock of NBCC appears to be showing signs of improving strength on the daily chart, supported by a combination of price structure, volume confirmation, and momentum indicators. Recent chart behaviour suggests the possibility of a constructive trend development after the formation of a notewort
NBCC - Bullish Head and ShoulderNBCC is currently forming a Bullish Head and Shoulder pattern, a classical reversal structure that often signals the end of a correction phase and the beginning of a new bullish trend.
The stock has completed the Left Shoulder, Head, and Right Shoulder formation and is now trading near the neckline
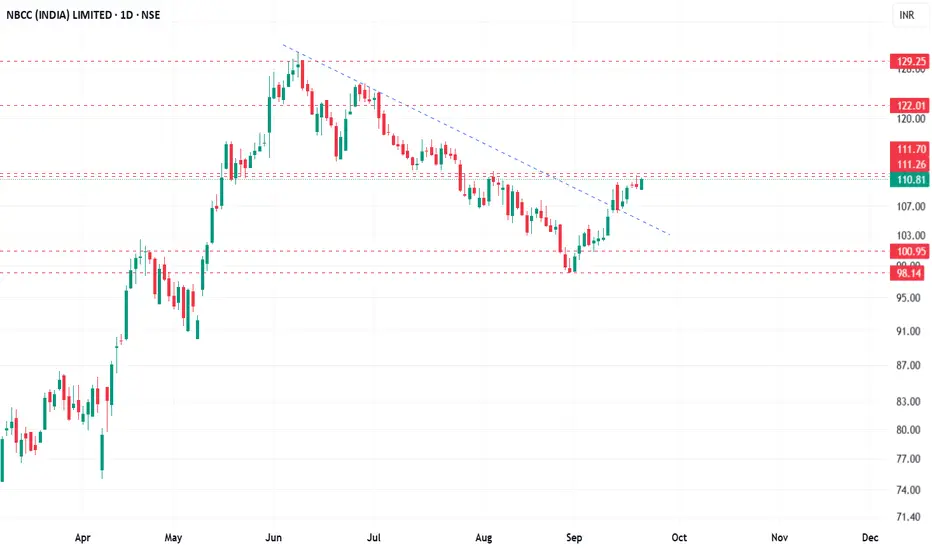
NBCC (India) Ltd. (NSE) on the DTF🔎 Technical Chart Analysis (Daily)
1. Price Structure & Trend
The stock rallied sharply till June 2025 (~₹129), followed by a correction.
Formed a falling trendline resistance, which has now been broken on the upside, indicating a shift from correction to recovery.
Currently consolidating around
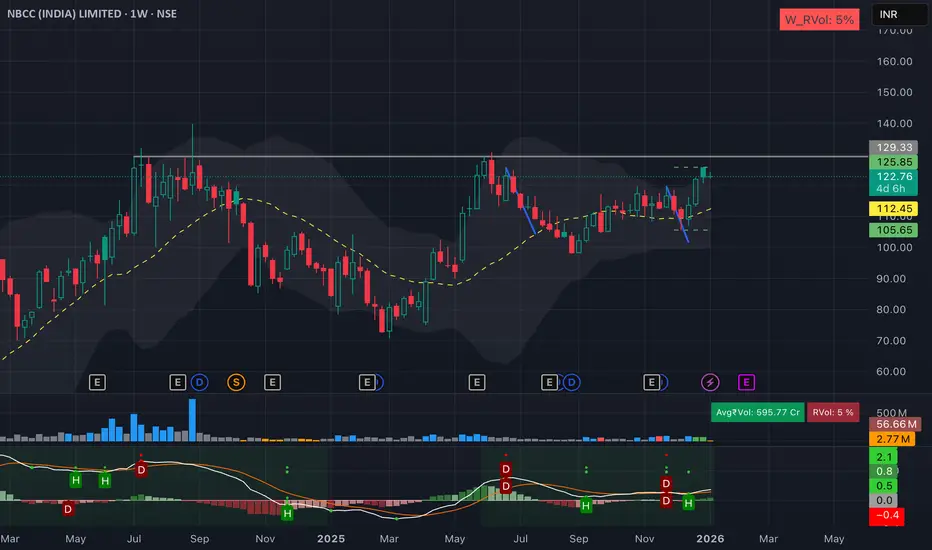
NBCC (India) Ltd | Weekly Consolidation Breakout SetupNBCC is showing a constructive weekly structure after a healthy pullback.
Price is holding above key moving averages
Higher lows indicate trend continuation
Tight consolidation near resistance suggests accumulation
Setup favors a range breakout on strength
Trade View:
Buy on strength above ₹125
Su
NBCC 1 Day Time Frame 📌 Live Price (Daily)
Current trading price: ~₹122.0 – ₹122.7 per share during the session.
Today’s range: ₹121.7 – ₹123.1.
52-Week range: ₹70.80 – ₹130.70.
📊 Daily Pivot & Key Levels
Daily Pivot Point (standard):
Pivot (P): ~₹122.7 – Acts as the central bias level.
Daily Support Levels:
S1: ~
See all ideas
Summarizing what the indicators are suggesting.
Neutral
Neutral
Neutral
An aggregate view of professional's ratings.
Neutral
Neutral
Neutral
Displays a symbol's price movements over previous years to identify recurring trends.
Frequently asked questions
The current price of NBCC is 74.46 INR — it has increased by 0.62% in the past 24 hours. Watch NBCC (INDIA) LIMITED stock price performance more closely on the chart.
Depending on the exchange, the stock ticker may vary. For instance, on NSE exchange NBCC (INDIA) LIMITED stocks are traded under the ticker NBCC.
NBCC stock has fallen by −4.90% compared to the previous week, the month change is a −12.71% fall, over the last year NBCC (INDIA) LIMITED has showed a −32.71% decrease.
We've gathered analysts' opinions on NBCC (INDIA) LIMITED future price: according to them, NBCC price has a max estimate of 160.00 INR and a min estimate of 127.00 INR. Watch NBCC chart and read a more detailed NBCC (INDIA) LIMITED stock forecast: see what analysts think of NBCC (INDIA) LIMITED and suggest that you do with its stocks.
NBCC reached its all-time high on Aug 28, 2024 with the price of 139.83 INR, and its all-time low was 3.24 INR and was reached on May 17, 2012. View more price dynamics on NBCC chart.
See other stocks reaching their highest and lowest prices.
NBCC stock is 1.69% volatile and has beta coefficient of 1.26. Track NBCC (INDIA) LIMITED stock price on the chart and check out the list of the most volatile stocks — is NBCC (INDIA) LIMITED there?
Today NBCC (INDIA) LIMITED has the market capitalization of 201.20 B, it has decreased by −1.78% over the last week.
Yes, you can track NBCC (INDIA) LIMITED financials in yearly and quarterly reports right on TradingView.
NBCC (INDIA) LIMITED is going to release the next earnings report on Nov 14, 2026. Keep track of upcoming events with our Earnings Calendar.
NBCC (INDIA) LIMITED revenue for the last quarter amounts to 22.59 B INR, despite the estimated figure of 27.46 B INR. In the next quarter, revenue is expected to reach 30.13 B INR.
NBCC net income for the last quarter is 1.55 B INR, while the quarter before that showed 2.41 B INR of net income which accounts for 0.00% change. Track more NBCC (INDIA) LIMITED financial stats to get the full picture.
Yes, NBCC dividends are paid quarterly. The last dividend per share was 0.46 INR. As of today, Dividend Yield (TTM)% is 1.26%. Tracking NBCC (INDIA) LIMITED dividends might help you take more informed decisions.
NBCC (INDIA) LIMITED dividend yield was 1.29% in 2025, and payout ratio reached 37.50%. The year before the numbers were 0.82% and 33.43% correspondingly. See high-dividend stocks and find more opportunities for your portfolio.
As of Oct 11, 2026, the company has 1.15 K employees. See our rating of the largest employees — is NBCC (INDIA) LIMITED on this list?
EBITDA measures a company's operating performance, its growth signifies an improvement in the efficiency of a company. NBCC (INDIA) LIMITED EBITDA is 7.34 B INR, and current EBITDA margin is 3.91%. See more stats in NBCC (INDIA) LIMITED financial statements.
Like other stocks, NBCC shares are traded on stock exchanges, e.g. Nasdaq, Nyse, Euronext, and the easiest way to buy them is through an online stock broker. To do this, you need to open an account and follow a broker's procedures, then start trading. You can trade NBCC (INDIA) LIMITED stock right from TradingView charts — choose your broker and connect to your account.
Investing in stocks requires a comprehensive research: you should carefully study all the available data, e.g. company's financials, related news, and its technical analysis. So NBCC (INDIA) LIMITED technincal analysis shows the sell today, and its 1 week rating is strong sell. Since market conditions are prone to changes, it's worth looking a bit further into the future — according to the 1 month rating NBCC (INDIA) LIMITED stock shows the sell signal. See more of NBCC (INDIA) LIMITED technicals for a more comprehensive analysis.