NBCC trade ideas

NBCC Cup and Handle PatternMedium Term Trade(2-3 Months): NBCC has broken out of a cup and handle pattern.
Buy: NBCC
CMP: 52.25
Target: 65
Stop Loss: 48

All the parameters are suggesting a strong buyAll the parameters are suggesting a strong buy (MACD , Moving Avg , RSI , Volumes , Candle Stick Patterns , Bollinger bands etc) it is bullish

NBCC Finally Wait is OverNBCC out of Jail, Now will Fly like a Free Bird.
Monthly Chart is Super Positive.
Buy on Dips Candidate.

Consolidated Much for some days.The stock is bottoming out, it can give good return in a short term. As soon as unlocking of states start goverment policy for new infrasture and housing projects will resume which can help investors .

NBCC FALLING-WEDGE-BREAKOUT PRICE ACTION VOLUME PROFILEDisclaimer-:
1. FOR WHOM VOLUME PROFILE AND MY METHOD IS A LITTLE NEW OR BLURRY . I WILL SOON PUT UP AN EDUCATIONAL POST WITH DETAILS AND EXAMPLES. WE CAN HAVE A SERIES OF DISCUSSIONS THERE TOO. DO FOLLOW MY ACCOUNT TO GET NOTIFIED.
2. Do ask your questions in the comments if any.
Volume Profile-:
Using Volume Profile one can identify probable accumulation or distribution regions by comparing the historical Volume at Price and current Volume at Price.
2. If the current volume is low, its mostly a pause before the trend resumes
3. If the current volume is higher or equivalent to historical levels then either the trend will resume or it may reverse. If it resumes then we have more strength in trend due to more accumulation. So a breakout/breakdown will confirm in this case
POC-: The red line in volume profile is called Point of Control. This is the level where max volume of transactions have taken place.
VALUE REGION-:
The violet region highlighted in volume profile is called value region. This is where 70% of total volume of the volume profile lies.
It means this region has value so, many transactions took place.
Firstly-:
NBCC fell steadily and nicely for a prolonged time in a wedge like formation (triangular). Recently Falling Wedge Breakout has happened. Moreover price has been rising in a small up-sloping channel making higher highs and higher lows.
In wedge pattern the trend lines have been tested at least 3 times. So the breakout is strong
IMPORTANT OBSERVATIONS-:
1. Recent Volume is extremely high as compared to volume when stock fell and since the price is rising making higher lows so definitely its an accumulation and soon there will be breakout and uptrend.
2. The upcoming region 50-70 has relatively high volume. This means the stock may stay there for a while or within that level it might face multiple resistances. Moreover 50-70 was previously an accumulation region.
3. But above 70 level volume of stock falling is very very low which means there is weak resistance. So once the stock breaks out of 70 level it might smoothly move upwards.
TARGET WITH LOGIC
1. Since the all the time high level, 146 NSE:NBCC stock has been falling with very low volume . While now the volume of accumulation is too high, so there is a high chance it can easily reach the all-time high. Moreover it might even go more than that, but it depends what happens after the breakout.
ENTRY-:
1. A risky entry would be above 50 level since 50-70 is in value region, so stock might face multiple resistance , or it might stay there in sideways and you want have capital appreciation
2. A better entry would be confirmatory breakout above 70 level since its a very strong resistance level and its less risky.
I will update here when breakout happens
STOP-LOSS
If your entry is above 50, 25-30 is a good stop-loss region. If it is above 70, 50 would be conservative stop-loss.
Stop-loss is deep but if your expected return or target is high, you have to put conservative stop-loss to avoid being stopped out unnecessarily. Since its a intermediate-term swing trade, a conservative stop-loss makes sense.
**STOP-LOSS should be trailed as per your strategy. One of the best is to trail with Moving Average in 1D timeframe with ATR( Average True Range ) as a buffer.
EXIT
Sometimes we have to exit before target is reached if there is bearishness. Following can be the clues of bearishness-:
1. If there is bearish candlestick pattern in 1W timeframe, stop-loss can be trailed to a nearby support level .(Like Candle Low)
2. If there is RSI Divergence in 1W timeframe, better to exit at close of 1W since afterwards there can be long consolidation or reversal.
3. If the trailing stop-loss is hit, please exit
4. If you want , you can keep a target level lower than the all time high and exit at Target. Possible levels are 100 and 120.
**IF YOU LIKE MY ANALYSIS, KINDLY GIVE A THUMBS-UP AND SHARE IT IF POSSIBLE, HELPS A LOT :)
**I WILL POST NECESSARY , SIGNIFICANT CHANGES IN THIS THREAD LIKE ADDITION TO POSITION, EXIT SIGNALS, BREAKOUT ETC.
TO AVOID MISSING OUT ON UPDATES PLEASE REMEMBER TO FOLLOW THE POST AND MY ACCOUNT.
**YOU CAN TURN ON NOTIFICATION TO BE UPDATED OF CHANGES
**ANY COMMENT ON THE ANALYSIS WILL BE HIGHLY APPRECIATED.

NBCC : 90 Days VCP PATTERN FORMATIONVolatility contracting from left to right.
Buy Range: 52-55
SL: 8% Max
Target: 15-25%

#NBCCThis is an Educational Chart.
Trade is based on Trendline - Use SL on WCB.
PSU Look super on Chart. Time frame is atleast a year.
Thanks
Any Qs let me know


Break Out// get ready to buyGood volume
Break out
Bullish Flag
buy if price starts above the support line.

NBCC - Bottomed OutLong weekly down trend appears to have bottomed out with a surge in volumes forming a "Cup" pattern.
Thereafter, slight retracement from marked yellow resistance zone confirms formation of the "Handle" to the "Cup".
Breakout of the Cup & Handle is indicative of a Bullish Reversal, which could push up towards the next resistance zone.
NFA. DYOR.

NBCC-Can accumulateNBCC at good R:R. RS is +ve, trading above all key moving averages and AVWAP in weekly time frame along with heavy volumes. Any closing above 52 can give a significant upside. One can accumulate but capital allocation should not be more than 5-7%. SL can be kept 30.

What Next Move for NBCC @50 LevelToday NBCC achieve our target of Rs 50. Now next hurdle @55. Book Profit at the current level for short-term view. As Of now,
1. Book Partial profit as it may rally further but the risk-profit ratio is not favourable till it crosses 55 then we can see the final target @ 65.
2. If it can not hold the current level 50 then it may fall to below 44.
From the nifty point of view, the next two sessions on 12 or 14 are crucial. Any day big move is going to come that decide nifty trend upward/downward.
Looking for the safer side, it better to book profit and wait for the level to break to enter again.


NBCCEnter above 53
SL at 48
Target 64/70/80
OR
Enter at CMP (might face resistance at 52-53 level)
SL at 42
Target 64/70/80

nbcc india bullish bat long termbullish bat pattern looks good in weekly chart , for long term target is 131

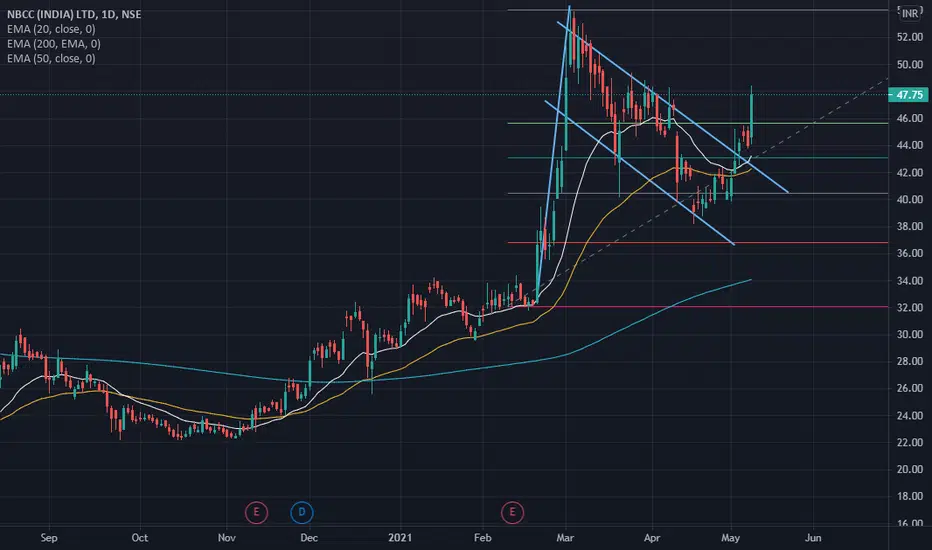
NBCC 36-45 price range breakout Breakout with volume from one year price range bound between 36-45. Finally give breakout and sustain.
Good to buy at CMP .


NBCC Bounces Back for upper targetLast week it bounces back and holds 40 level. Now waiting for the 50 rs target in this week.
