Reliance, "The Largest Of Large Caps"Date 14.09.2026
Reliance (Fut)
Timeframe : Weekly Chart
"The Largest Of Large Caps"
"20% year-to-date in 2026"
Technical
(1) Whats not displayed on the chart is, Reliance broke weekly 200 EMA
(2) Been consolidating foe the last 15 weeks now , below weekly 200 EMA
(3) Upper range of consolida
Reliance Nears Multi-Month BreakoutHighlights
* Reliance Industries has regained momentum after a prolonged consolidation phase, supported by strength across its retail, digital, and O2C businesses. The stock has been steadily attracting institutional interest and is now trading near a crucial technical resistance.
* The stock i
Reliance Shows Strength AheadHighlights
* Reliance Industries is maintaining a positive technical structure, supported by steady buying interest near key levels.
* The stock is trading above important moving averages, indicating that the medium-term trend remains favorable.
* Momentum indicators suggest improving strength, thou
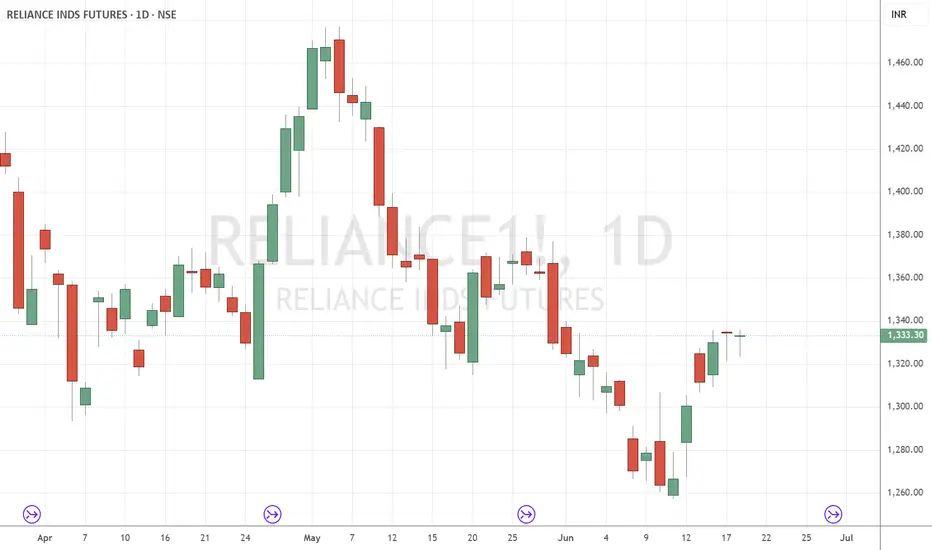
Reliance:10jun2026 bearish mode, Reversal only possible above 1320 close.
Currently at support,
If current support is broken, further downside towards 1200-1100 can be seen.
Ril is highly volatile and dependent on crude prices.
Disclaimer: only for educational purpose, not a buy or sell recommendation.
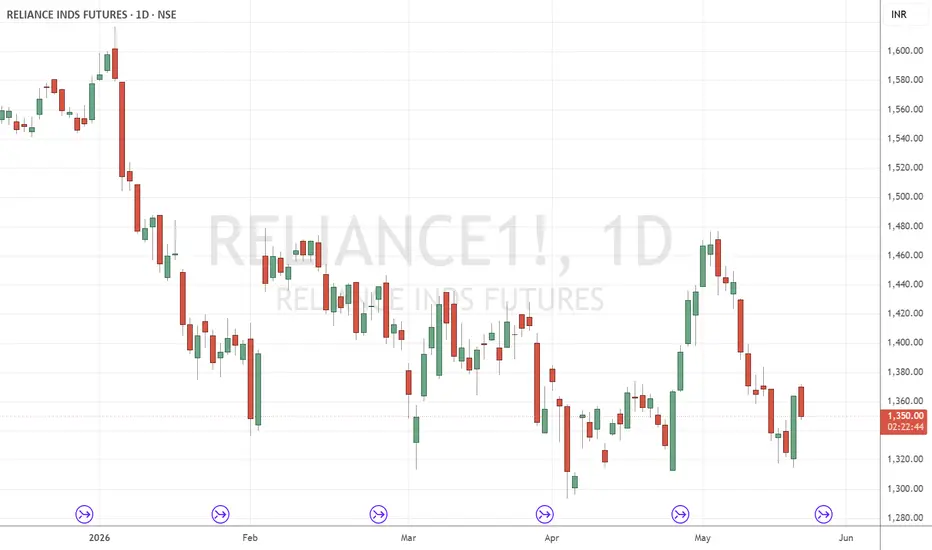
Reliance Technical Analysis View — Weak Bias Below 1,380Key Points
1. Reliance is trading with a cautious tone
Reliance Industries is currently showing weakness after facing selling pressure near higher levels. The stock is trading below important moving average zones, which keeps the short-term trend slightly negative.
2. Immediate resistance is ne
Unlocking Market Insights through Volume AnalysisTrading in financial markets is often considered both an art and a science. Among the various analytical tools traders use, volume analysis stands out as a crucial method for understanding market behavior, predicting price movements, and making informed trading decisions. Volume refers to the total
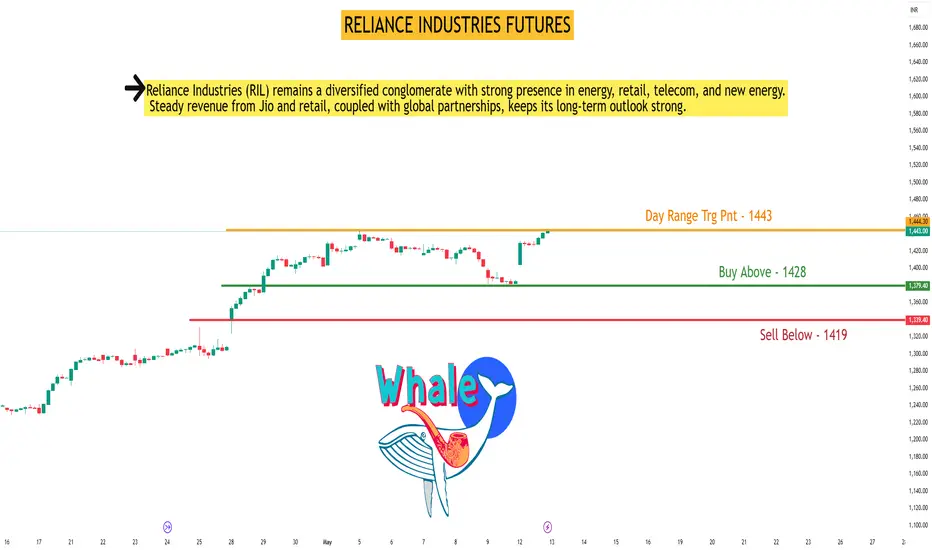
RELIANCE INDUSTRIES FUTURESRELIANCE Future Intraday Technical Analysis Date - 13-May-25 (Tuesday)
Day Range Trigger Point: 1443 | Expected Move: 41 pts
Buy Above: 1428
Average Buy Position: 1424
Target 1: 1468 |
Target 2: 1483
Stop-loss: 1415
Sell Below: 1419
Target 1: 1417 | Target 2: 1402
Stop-loss: 1432
Trading Str
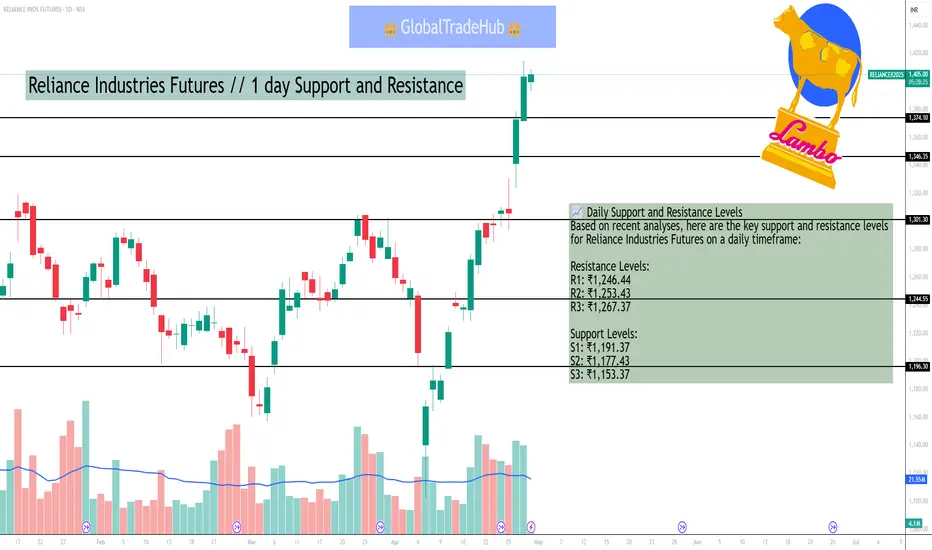
Reliance Industries Futures // 1 day Support and ResistanceAs of April 30, 2025, the Reliance Industries Futures (NSE: RELIANCE) closed at ₹1,235.80, up 0.16% from the previous close of ₹1,233.80. The futures market indicates a slight bullish sentiment, with open interest increasing by 4.82%, suggesting that traders are holding onto long positions.
📈 Dai
Reliance Future Intraday Technical Analysis for 2nd Apr.🚀 Unlock the potential with my Reliance Future Intraday Technical Analysis for 2nd Apr., 2025!
✨ Boost, follow, and engage for updates. Your support means a lot! 🚀❤️
📍 Day Range Trigger Point (DRTP): 1260
📅 Expected Day Range: 30
📈 Long Position
🔹 Buy Above: 1273
📊 Average Position: 1270
🎯 Target
Reliance Ind. Future Weekly Analysis 31st Mar to 4 Apr, 2025 🚀 Unlock the potential with my Reliance Industries Future Weekly Technical Analysis for 31st March to 4th April 2025!
✨ Boost, follow, and engage for updates. Your support means a lot! 🚀❤️
📍 Weekly Range Trigger Point (WRTP): 1,282
📅 Weekly Range: 41
📈 Long Position
🔹 Buy Above: 1,299
🎯 Target 1:
See all ideas
A representation of what an asset is worth today and what the market thinks it will be worth in the future.
Displays a symbol's price movements over previous years to identify recurring trends.
Frequently asked questions
The nearest expiration date for RELIANCE INDS FUTURES is Feb 25, 2021.
Traders prefer to sell futures contracts when they've already made money on the investment, but still have plenty of time left before the expiration date. Thus, many consider it a good option to sell RELIANCE INDS FUTURES before Feb 25, 2021.