Crude Oil Levels for 9-5-22Crude Oil important levels for 9-5-22 . Marked levels are for guidance purpose only and in no way a buy or sell recomendation.
CL1! trade ideas

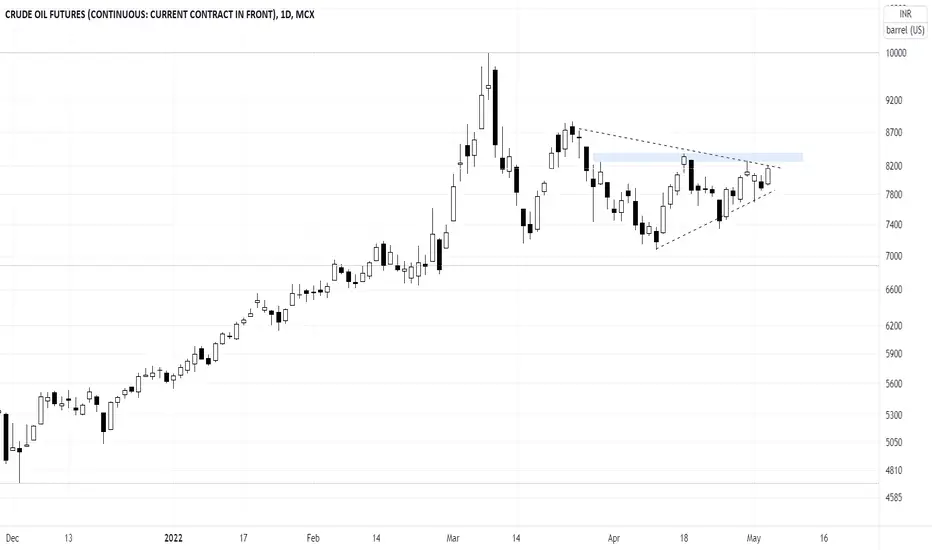
Crude - Symmetrical Triangle Crude is forming a symmetrical triangle. Currently, it is facing a resistance level of 8300 levels but if this level is crossed then we can see a quick move!
Concepts - Symmetrical Triangle ( Pattern Analysis )
Resistance Levels
Crude Oil levels for 6-5-22 Crude Oil Levels for 6-5-22. Levels are marked for intraday trading purpose and for guidance only. Levels are not for buy or sell crude.

crudeoil levels for 5-5-22 Important levles for crude oil for 5-5-22. Levels are marked for guidance purpose only . Price is moving with trend line marked. You can consider the trend line as support for crude oil.

crudeoil levels and trends for 4-5-22Crude Oil levels and trends for 4-5-22. These levels are marked for guidance purpose only.


crude oil levels for 2-5-22important levels for intraday 2-5-22 . Major support and resistance zones for crude oil MCX .

crudeoil levels for 29-4-22Crude oil Levels for 29-4-22. Levels are adjusted as per recent price action .

crudeoil levelsCrude oil levels for 28-4-22 . Important levels marked for crude oil . pivot levels where price can take action.

Crudeoil Bearish Bat pattern foundThere is an harmonic pattern found in crudeoil mcx and Usoil.
Entry & stop marked red and black, targets in blue color.
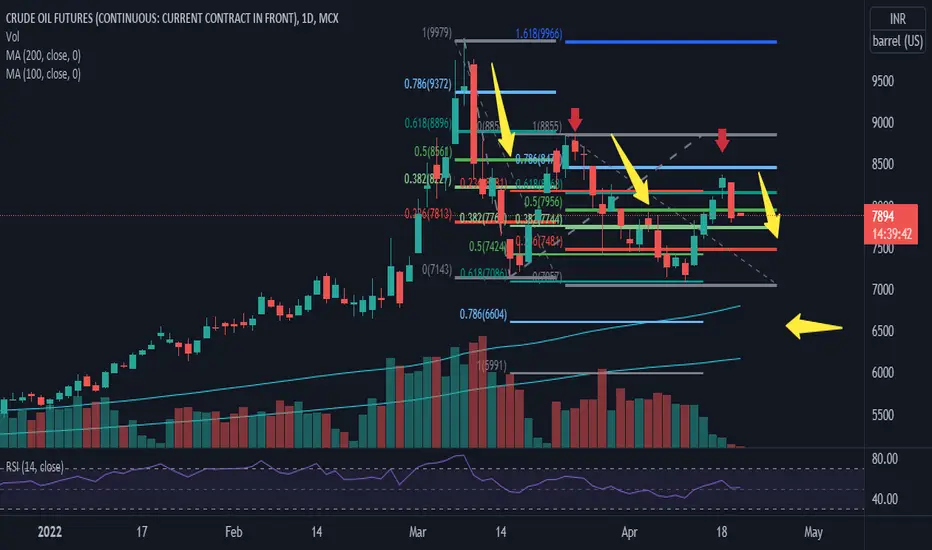
Note: Always try to find a good price action patterns or any candle stick patterns in marked zones in smaller timeframe to take entry with small stop loss. If you follow diagonal trendlines you can take entry and exit easily. (Color code (only for diagonal trendlines ): green - bullish , red - bearish , black & violet reversal points). If any doubt for take entry in price action patterns, please ask in comment box, i will try to help.
Disclaimer: Im not tip provider and this chart is not indented to take trade in my levels, It is shared here for learning purpose. It is all your own risk.

#CRUDEOIL POSSIBLE TO SELL#CRUDEOIL opened negative and moved 7812,
and taken support range arund 7800
and resistense range around 7950 and positionally
selling range around 7950 and then it may come
7700-7620 levels

crudeoil levels for 27-4-22 levels are marked for intraday crude oil . These levels are marked for guidance purpose only .

Crude oil isn't coming down any soon CL1! futures broke out of its upward channel in late February and now the upper end of this channel is acting as a good support. If it continues to hold these levels, new highs will be seen pretty soon!

Strong reversal showing WTI 1 hr Chart Fundamental Development : Oil was up on Tuesday morning in Asia opening higher after falling sharply during the prior session. WTI futures were up 0.97% to $99.50. Both Brent and WTI benchmarks ended the previous session down around 4%, with Brent tumbling as much as $7 a barrel during the session and WTI falling roughly $6 a barrel. China will keep liquidity reasonably ample in financial markets, the People's Bank of China said in a statement on Tuesday, a day after the central bank announced a cut to banks' foreign exchange reserve ratio to support the economy.
Short Term Technical View: As per bollinger band indicator WTI future is taking strong reversal at support level 95.80 , Technically RSI Indicator also indicate reversal in the chart and showing bullishness above 50 level and increasing volume at support level showing strong buying , As per my view If WTI break today days high of 99.85 and CB Consumer Confidence data release in U.S. Session also indicate positive so it will be great opportunity to buy WTI futures above 99.85 with the target of 101.75 and take a stop loss at 98.68 .
Alternative Scenario : If WTI future will not sustain above 99.50 level and break today low 95.80 and CB Consumer Confidence data release in U.S. Session also indicate negative so it will be great opportunity to short sell WTI futures below 95.80 level with the target of 93 and take a stop loss of 97.50 .

Crude Oil levels for 26-4-22Crude Oil levels for 26-4-22 . Levels are marked on intraday basis only and for guidance purpose only .

Crudeoil levels for 26-4-2022As per price action crudeoil is in sell on rise mode.
Note: Always try to find a good price action patterns or any candle stick patterns in marked zones in smaller timeframe to take entry with small stop loss. If you follow diagonal trendlines you can take entry and exit easily. (Color code (only for diagonal trendlines ): green - bullish, red - bearish, black & violet reversal points). If any doubt for take entry in price action patterns, please ask in comment box, i will try to help.
Disclaimer: Im not tip provider and this chart is not indented to take trade in my levels, It is shared here for learning purpose. It is all your own risk.

Crudeoil levels for 25-4-22 Crudeoil Levels for intraday 25-4-22 . Levels are marked just for guidance purpose only . In no way this is a buy or sell recommendation.

Descending chart patternDoes this look like a descending triangle chart pattern. Do you think that crude oil prices will trade lower in the coming months? What are your thoughts?

CRUDEOIL///CRUDEOIL/// is trading at a very narrow range since past one week and taking support of the trendline...expecting upside for another 1500 points .

CrudeOil Levels for 21-4-22Crude Oil Levels marked for intraday trading. Levels are marked as per recent price action.

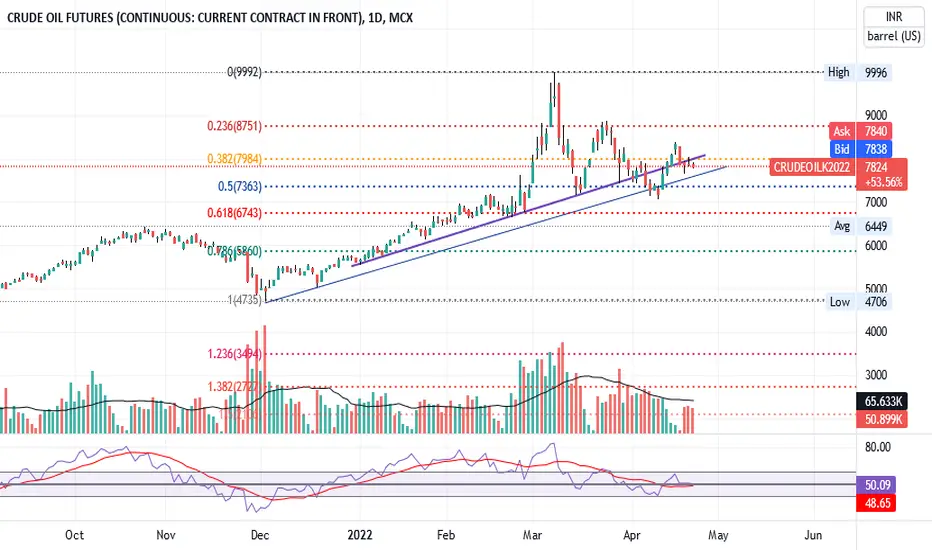
Crude forming Perfect reversal on Fibo levelsCrude is almost topped out based on the observation of Fibonacci levels.
Crude Oil Levels for 20-4-22 .Levels are marked for intraday trading purpose on Crude Oil for 20-4-22. Levels are marked on 30 Minutes Time Frame but for trading time frame is 3 minute or 5 minute as per ....
