LONG GAIL.NSThe chart of this stock is forming a beautiful pattern & there's a clear buying opportunity as we can see the price has taken a clear bounce back from major support level {1.) On the base of the pattern 2.) On the daily timeframe of the chart } along with huge volumes.
NOT A BUY/SELL RECOMENDATION. FOR LEARNING PURPOSE ONLY
Gail India Ltd.
No trades
Trade ideas

GAIL (Weekly Chart) – Pattern & Levels Breakdown🔻 Descending Triangle Breakdown
Price has been respecting a descending triangle:- Flat support near ₹174.
Lower highs forming a down-sloping resistance.
Recent weekly candle has closed below the demand trendline → signalling weakness.
Breakdown Level: ₹174
📌 Fibonacci-Based Downside Targets
Based on the last swing:
Fib 23.6%: ₹154.90
Fib 38.2%: ₹143.60
Fib 50%: ₹127.51
Major Fib 78.6%: ₹115.67 (Strong support zone)
📉 Volume Confirmation
Breakdown candle occurred with elevated volume.
Sellers are active. Demand zones are being tested with weak buying response.

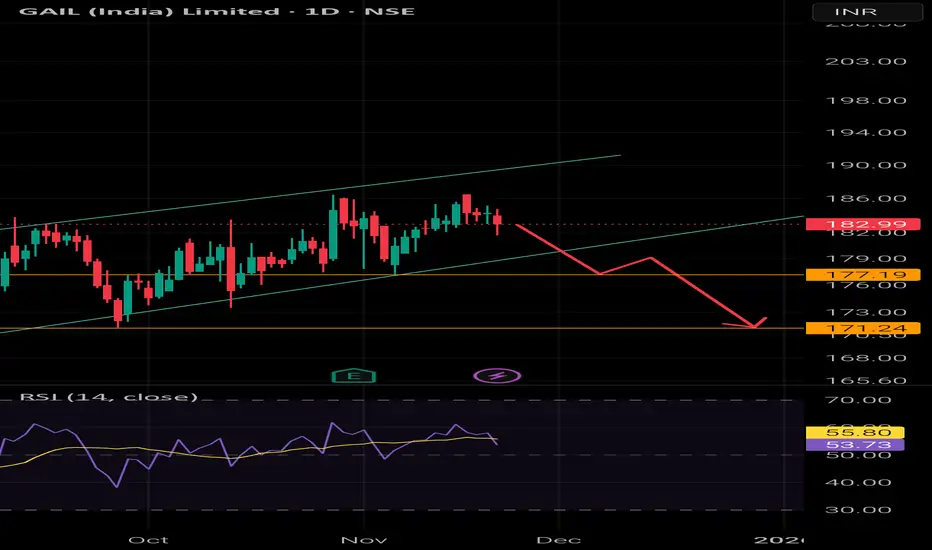
Rising Wedge PatternGAIL is forming a classic Rising Wedge pattern. The immediate targets can be nearest Support. A bearish Strategy can work well in this case
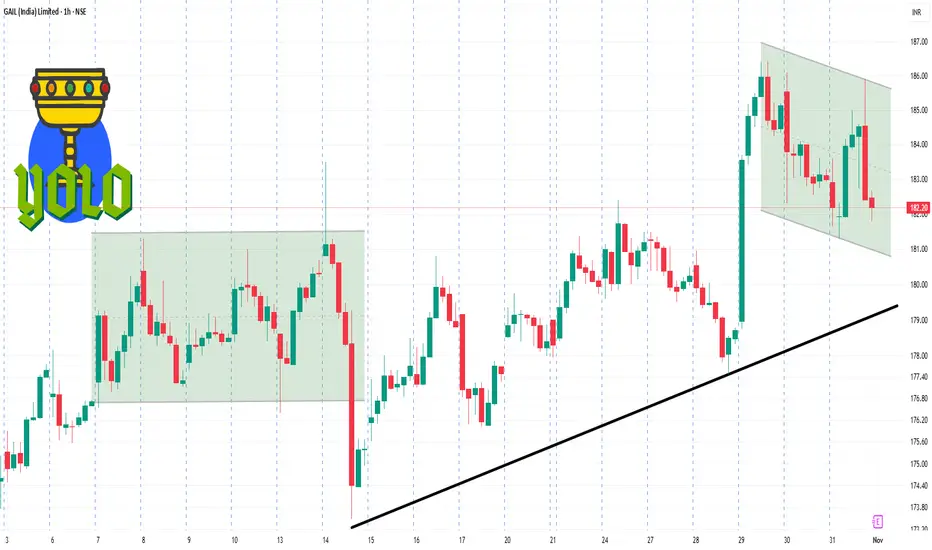
GAIL 1 Hour Time Frame✅ Key Levels
Resistance zone: ~ ₹186-₹190 — the stock recently tried to challenge this region (see intraday high ~₹191 in some sessions).
Support zone: ~ ₹174-₹176 — the lower bound of recent trading range (Moneycontrol shows recent low ~₹174.64).
Intermediate pivot: ~ ₹180-₹182 — currently acting as the mid-zone / equilibrium in 1-hour structure.
GAIL (India) Ltd 1 Day Time Frame 📊 Key Technical Indicators
Relative Strength Index (RSI): Approximately 58.89, indicating a neutral to bullish momentum.
Moving Average Convergence Divergence (MACD): Around 0.58, suggesting a bullish trend.
Simple Moving Averages (SMA):
5-Day: ₹179.11
50-Day: ₹177.17
200-Day: ₹177.3
These values indicate a bullish sentiment, as the stock is trading above these averages.
📈 Support and Resistance Levels
Immediate Support: ₹177.20
Immediate Resistance: ₹182.50
A breakout above ₹182.50 could signal a continuation of the uptrend, while a fall below ₹177.20 might indicate a bearish reversal.
🧭 Summary
GAIL (India) Ltd. is currently in a neutral to bullish phase on the daily chart. Key indicators like RSI and MACD support this outlook, and the ascending triangle pattern suggests potential upward momentum. However, traders should monitor the support and resistance levels closely to assess the next move.
GAIL India Ltd: Assessing Investment Potential Technical Analysis: Butterfly Pattern and Support Levels
GAIL India Ltd has formed a butterfly pattern in its stock chart, currently trading with a 30% decline from its recent highs. The stock is finding support around the ₹170 level, which may present a strategic entry point for long-term investors.
Fundamental Performance Overview
Revenue Performance: In the last fiscal year, GAIL reported a 10% increase in revenue, driven by higher demand for natural gas and petrochemical products, despite facing challenges in the global energy market.
Net Profit: The company experienced a decline in net profit, with figures dropping by approximately 25% year-over-year, primarily due to increased operational costs and lower margins in some segments.
Price-to-Earnings (P/E) Ratio: The current P/E ratio stands at around 18.5, which is competitive compared to industry peers, suggesting that the stock may be fairly valued relative to its earnings.
Debt Levels: GAIL maintains a manageable debt-to-equity ratio of 0.45, indicating a balanced approach to leveraging while ensuring financial stability.
Return on Equity (ROE): The company reported an ROE of 12.5%, reflecting its effectiveness in generating profits from shareholders' equity.
Dividend Yield: GAIL offers a dividend yield of approximately 4.2%, providing attractive returns to investors, especially during market volatility.
Market Capitalization: As of January 2025, GAIL India has a market capitalization of approximately ₹70,000 crore, positioning it as one of the leading players in the natural gas sector.

GAIL Bullish way ahead?!!!Chart patterns suggest me the above titled opinion
1. Its is travelling in a Ascending channel pattern making Higher highs and higher lows .
2. Now it is at the bottom support loading for the explosive move ahead.
3. Let's wait for the Breakout and enter.
Target levels mentioned in chart...SL update after breakout.
Longer time frames also shows the bullish edge in GAIL
This is just my opinion..... not a tip nor advice!!!!
Thank you!!!

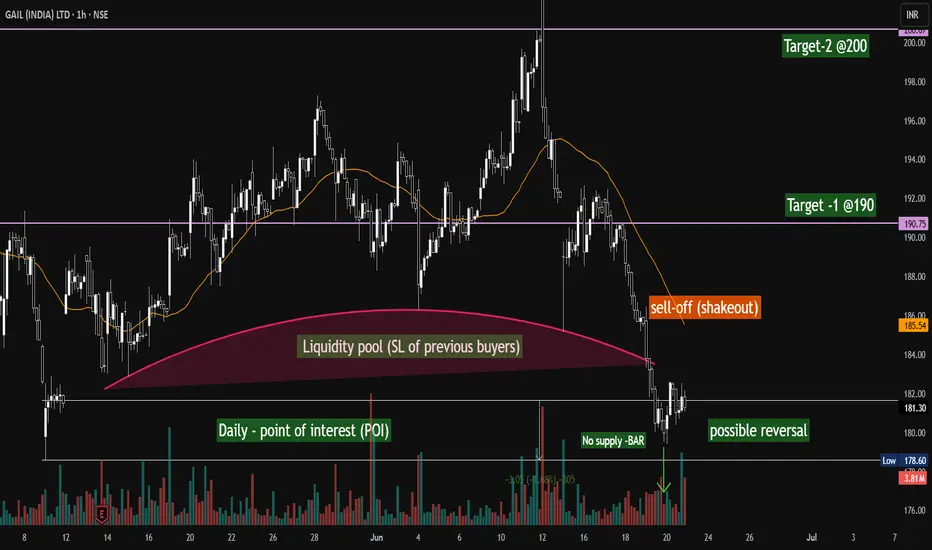
GAIL (INDIA) - Possible Reversal on the corner...GAIL (India) Ltd – 1H Chart Analysis (NSE) | June 21, 2025
Spotted a potential setup with key institutional footprints on the 1H chart:
🟥 Liquidity Pool Grab: Price dipped into the liquidity zone (SL sweep of previous buyers), potentially clearing weak hands.
📉 Shakeout Sell-Off: A sharp decline hints at a textbook shakeout—classic Wyckoff-style distribution at work.
✅ Daily POI + No Supply Bar: Price tapped into a higher timeframe (Daily) Point of Interest, accompanied by a low-volume no-supply bar—suggesting buyer strength.
🔁 Possible Reversal Brewing: Early signs of bullish intent emerging. Watching this zone for confirmation.
🎯 Targets in Sight:
Target 1: ₹190
Target 2: ₹200
Patience pays !!! —waiting for a break of structure and strength to follow through.
Short GAIL till 175 SL 192 Buy at 175 again and hold for upside🔍 Technical Breakdown (as per chart)
1. Rising Support Trendline
The white upward sloping trendline is currently acting as a long-term support.
Price is now approaching this trendline, which sits near ₹180–182 zone — a strong demand area.
2. Gann Time Cycle / Vertical Lines
Blue and yellow vertical lines seem to indicate past cycle turn dates.
The next major blue cycle line is seen near end of June. Historically, blue lines align well with local reversals (e.g., March, May, June).
This implies a potential bounce or reversal is due around the last week of June.
3. Price Action
Price has corrected from ~₹203 to ₹185.
Current candle shows loss of momentum with smaller body, signaling possible slowing of selling pressure.
Still no bullish confirmation yet, but price is near trendline and timing zone, which is a high-probability area for reversal.
4. Pattern & Structure
A falling wedge/flag breakdown is NOT confirmed yet.
Price is still making higher lows, so structure remains bullish unless ₹180 breaks.
🎯 What You Should Do (Based on Our Training)
Scenario Action Plan
If Already Holding ➤ Continue holding with a strict stop-loss of ₹178 (closing basis).
➤ Add more if reversal signal (bullish candle) appears around ₹180–182.
If Planning Entry ➤ Ideal entry zone: ₹181–184 with stop below ₹178.
➤ Wait for a bullish engulfing, hammer, or morning star pattern on trendline.
If Trendline Breaks ➤ If it closes below ₹178, exit or stay out. Wait for next cycle near ₹165–168 zone.
For Short-Term Trade ➤ Look for a quick bounce setup from ₹180 zone to ₹190–192 (gap-fill or mean reversion).
🧠 Key Learning-Based Summary:
Factor Status
Trend Bullish (Higher Lows Intact)
Support Zone ₹180–182
Time Cycle Reversal Due around end of June
Risk Level Low near support
Bias Wait for bullish confirmation – then enter long
✅ Final Verdict:
Don't rush. Let ₹180–182 zone show strength first. If bullish reversal candle forms near that with support from time cycle — go long with SL ₹178 and target ₹192–195

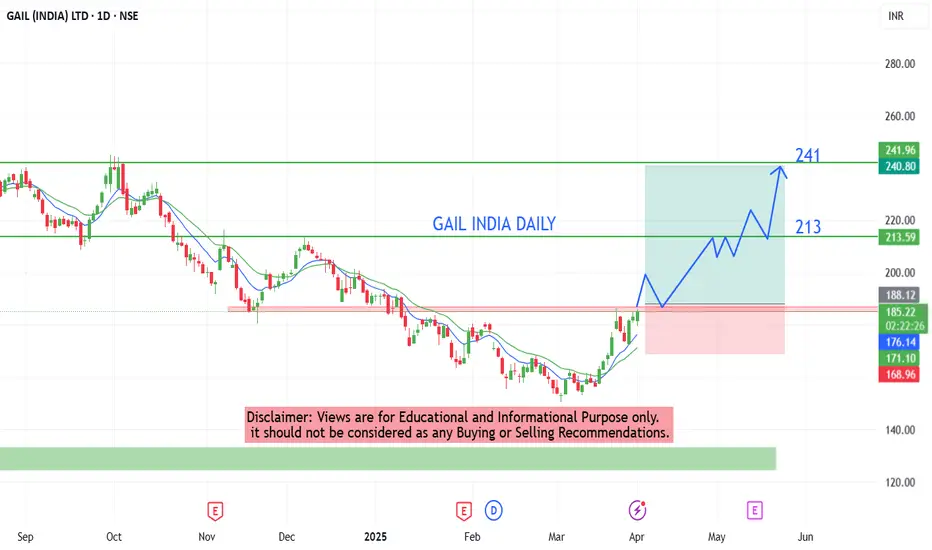
GAIL – Daily Timeframe , about to boomFollow us for more such content.
GAIL is showing strong signs of a bullish breakout, with price holding steadily above key moving averages and positive trend indicators. Institutional accumulation appears to be behind this move, and a close above resistance could see significant upside.
There is a high chances for upcoming move in bullish side
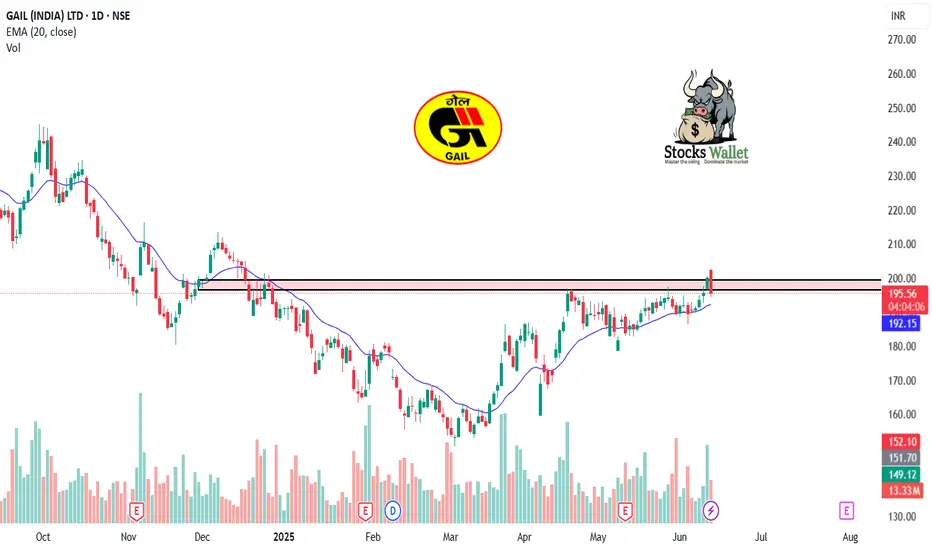
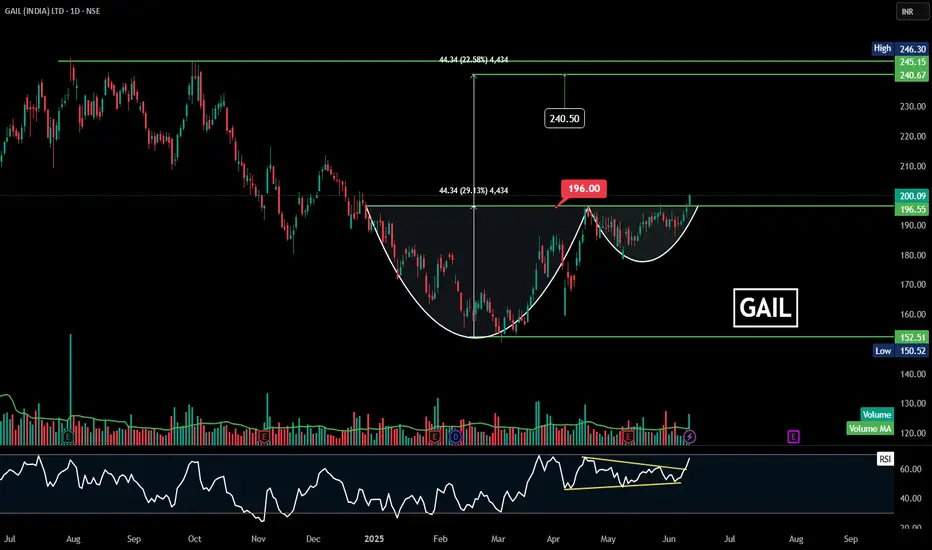
GAIL | Cup and Handle | Breakout | Daily
### 🏺 **Pattern Overview:**
✅ **Cup and Handle Breakout:**
* **Cup bottom:** \~₹152.51
* **Handle breakout level:** ₹196.00 (recently crossed)
* **Current price:** ₹200.09
The **measured move** (height of the cup) suggests a **target price of ₹240.50**.
---
### 📊 **Key Chart Levels:**
* **Resistance/Target:** ₹240.50–₹246.30
* **Immediate support:** ₹196.55 (breakout level)
* **Volume surge:** Volume picked up on breakout – strong confirmation.
* **RSI:** Clear breakout of downtrend line (marked in yellow), indicating momentum shift.
---
### 🔍 **What’s Next?**
* If price holds above ₹196.00, the move towards ₹240.50 is probable.
* A retest of ₹196.00 (handle breakout level) can be an opportunity for confirmation.
---
### 💡 **Key Takeaway:**
GAIL has completed a **Cup & Handle breakout** pattern. The breakout is confirmed with price and volume action, and RSI supporting strength. A medium-term target of **₹240.50–₹246** is on the cards.
Would you like me to draft a **video script** or **write-up** for these insights? Let me know! 🚀
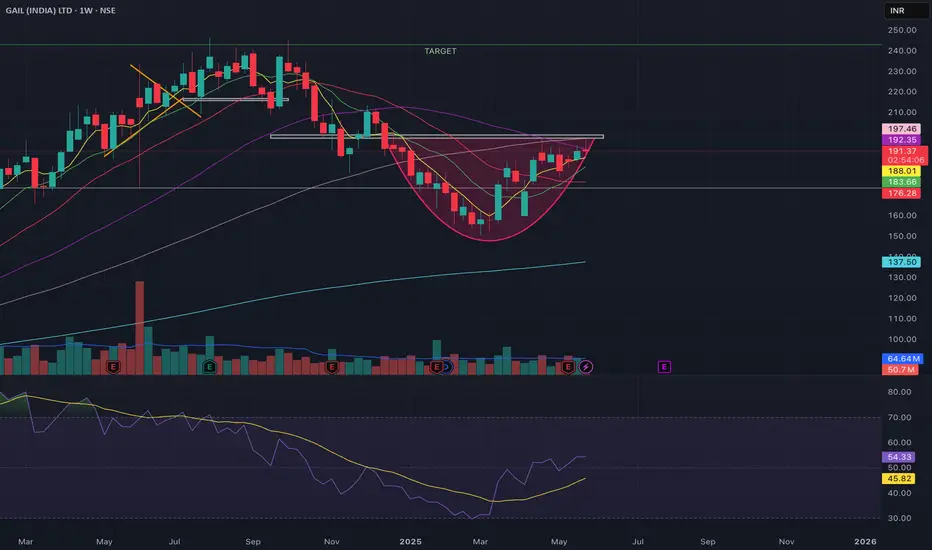
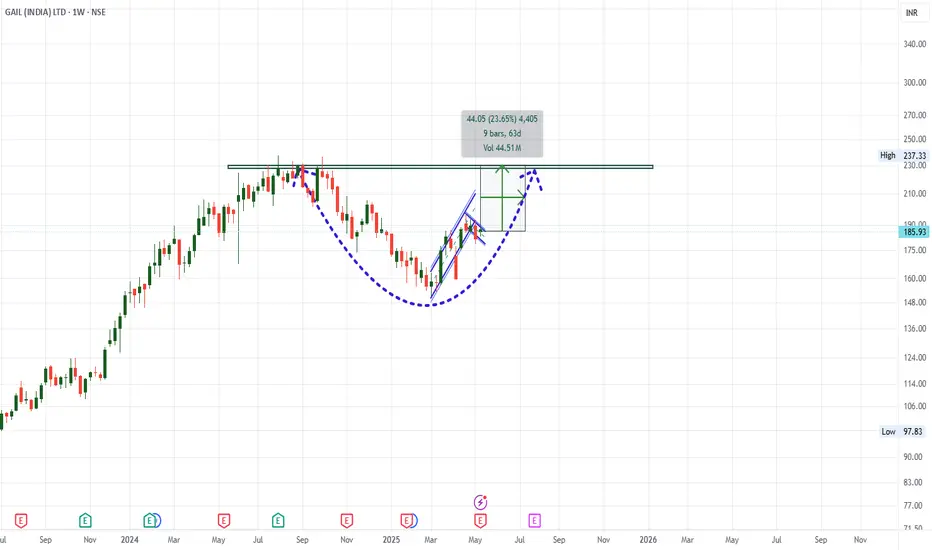
GAIL is all set to touch 240ROUNDING pattern in W.
Presently at resistance of 200.
Strong build ups are happening Week on Week.
RSI divergence with strength.
MA supports are taken.
Target of 240+ , SL 180, CMP: 192
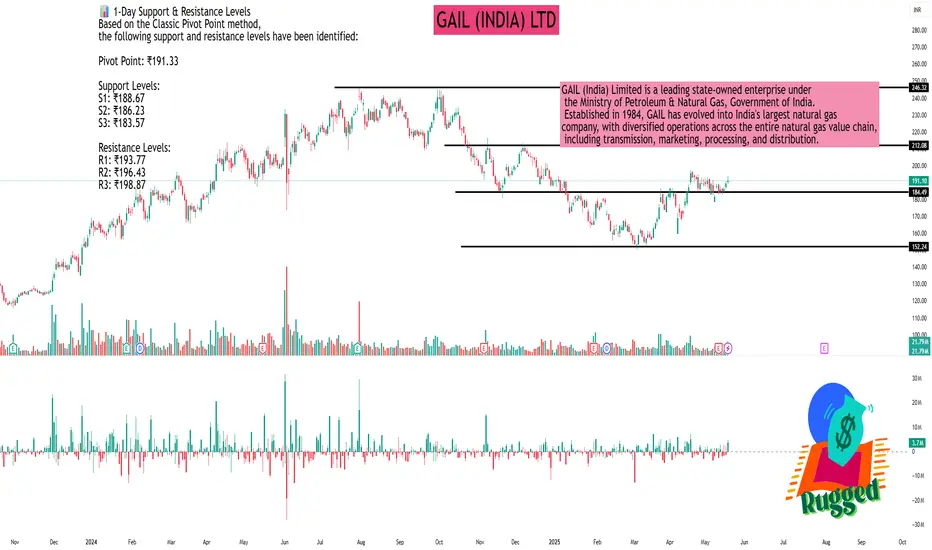
GAIL (INDIA) LTDAs of May 21, 2025, GAIL (India) Ltd. (NSE: GAIL) is trading at ₹191.10, reflecting a 0.86% increase from the previous close.
📊 1-Day Support & Resistance Levels
Based on the Classic Pivot Point method, the following support and resistance levels have been identified:
Pivot Point: ₹191.33
Support Levels:
S1: ₹188.67
S2: ₹186.23
S3: ₹183.57
Resistance Levels:
R1: ₹193.77
R2: ₹196.43
R3: ₹198.87
📈 Technical Indicators
Relative Strength Index (RSI): 60.63 – Indicates bullish momentum.
MACD (12,26): 1.34 – Suggests a bullish crossover.
Average Directional Index (ADX): 35.59 – Reflects a strong trend.
Commodity Channel Index (CCI): 48.46 – Neutral.
Rate of Change (ROC): 2.75 – Positive momentum.
Money Flow Index (MFI): Not specified.
📉 Moving Averages
50-day EMA: ₹226.29
200-day EMA: Not specified.
The current price is below the 50-day EMA, indicating a potential bearish trend in the short term.
🔍 Market Outlook
GAIL (India) Ltd. is exhibiting mixed signals. While technical indicators like RSI and MACD suggest bullish momentum, the stock trading below its 50-day EMA indicates caution. Traders should monitor the support and resistance levels closely; a breach above R1 (₹193.77) could indicate further upside, while a drop below S1 (₹188.67) might suggest a potential decline.
Trendline BreakoutA trendline breakout occurs when the price of an asset moves decisievly above a downward- sloping trendline, potentially signalling a change in the prevaling trend.
Entry at around 190
with stop loss of 180 we can target 207 one it closes above 196.

Gail 28% Upside possibility in next 3-4 MonthsGail 28% Upside possibility in next 3-4 Months
Now that the Gail Results are already declared & no much surprise notices ... Stock may be ready to breakout from current flag Pattern to reach its ATH 230-240 Band.
Also Weekly chart suggest CUP formation in progress post Bottom formation near 152.
LTP - 186
Targets - 240 - 28% upside
Timeframe - 3-4 Months.
SL - 170
Happy Investing.
Buy Gail It is going to reverse in a positive manners as gail has got a huge order from karnataka and the price is also at resistance level so guaranteed increase in a short term for a 3 days ...buy and sell and enjoy..

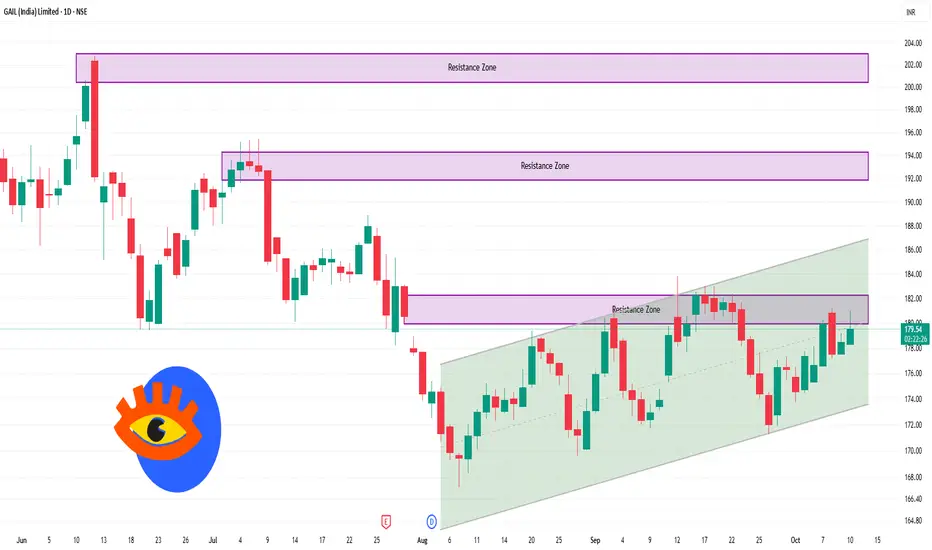
Gail india Chart Looking for Good daily TimeframeGail india Chart Looking for Good daily Timeframe. gail india chart Ateempt multitime this Resistance so this Resisatnce is week if Stocks break this resisatnce wait for Pullback And See The Confirmation so I will go for long For Upcoming weeks.
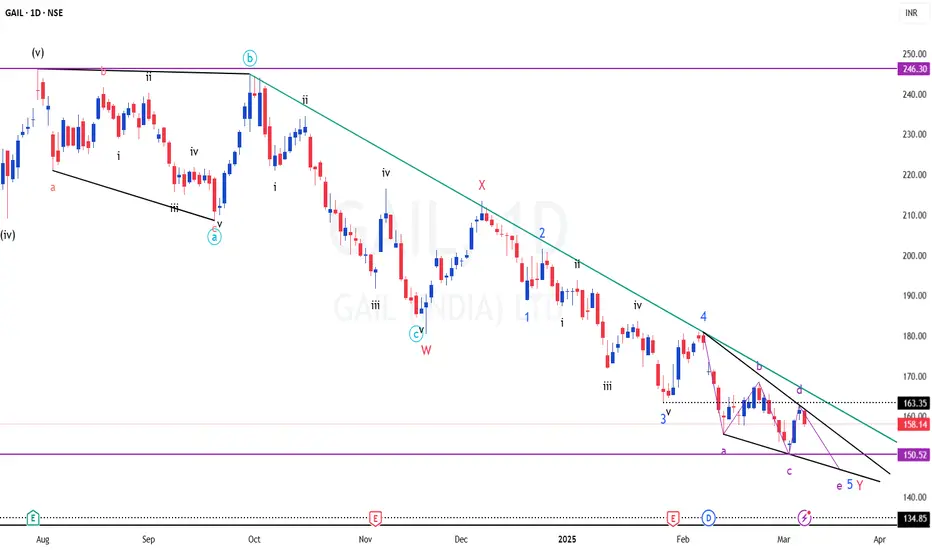
GAIL & EW Corrective PatternsTF: Daily
This looks like the darling of Elliott Wave Practitioners.
It has all the possible corrective patterns
Be it ABC, WXY, abcde and 12345
Diagonals at the top and the bottom.. Impulse waves in the middle.. you cant ask for more
Long story short - a touch down at the lower trendline (black) to complete the diagonal is due...
In principle, The E point must go below the C point, therefore a move below 150 is possible
Whether the correction ends at Y or will it be extended like WXYXZ..? we will know later.
For now, we are almost nearing the bottom..
Waiting for a breakout above the Falling trendline (Green) from the top.
I am not a SEBI registered Analyst. Views are personal and for educational purpose only. Please consult your Financial Advisor for any investment decisions. Please consider my views only to get a different perspective (FOR or AGAINST your views). Please don't trade FNO based on my views. If you like my analysis and learnt something from it, please give a BOOST. Feel free to express your thoughts and questions in the comments section.
At trendline crossoverGAIL CMP 159
At strong trendline crossover and Fib support. Its a high prob reversal zone.

GAIL - EXPECTING A BOUNCESymbol - GAIL
CMP - 158.10
GAIL Ltd. has been following a downward trend over recent months, with the overall technical structure remaining bearish. However, the stock has recently reached a crucial support zone, which lies between the 154-162 range, a level that has held strong since January 2024. This area serves as a key support zone, and it could offer the stock a potential bounce from its current bearish trend.
The stock is currently forming a rounding top pattern, a classic bearish formation that indicates a possible continuation of bearish trend at current levels or even trend reversal. Despite the overall bearish pattern, the price is consolidating near this important support level, which increases the probability of a bounce. While a short-term upward move is possible, the stock may resume its downtrend after this bounce.
In the short term, the trend is still slightly bearish. The stock has encountered some selling pressure near its support zone but is testing the resilience of this critical level. For me, The current market price around 158 offers an opportunity for a long position. It may be prudent to add more to this position as the price moves toward 153-152, while keeping a stop loss at 148 to manage risk.
However, if the stock breaks below 150 and sustains below this level, the current bounce scenario would be invalidated, and the stock would likely face further selling pressure, accelerating the downtrend.
Disclaimer - Do not consider this as a buy/sell recommendation. I'm sharing my analysis & my trading position. You can track it for educational purposes. Thanks!

Gail Let's perform a **technical analysis** of **GAIL India Ltd.** (GAIL) based on key technical indicators. Since I don't have real-time market data, I'll guide you through the analysis framework, and you can apply it with the latest data from a charting platform.
---
### **Technical Analysis of GAIL India Ltd.**
#### **1. Support and Resistance Levels**
- **Support Levels:**
- Support levels are price zones where the stock has historically reversed from a downtrend.
- **Example Support Levels:** If GAIL has previously found support at ₹105, ₹100, or ₹95, these are important levels to monitor. A drop below these levels could signal further weakness.
- If the stock is near support and starts to bounce back, this could indicate a potential buying opportunity.
- **Resistance Levels:**
- Resistance is where the stock has faced selling pressure or turned down in the past.
- **Example Resistance Levels:** Look for levels such as ₹120, ₹125, or ₹130, where the stock has previously struggled to move higher.
- A breakout above these levels could signal that the stock is entering a new bullish phase.
#### **2. Moving Averages (MA)**
- **50-day Moving Average (MA):**
- The 50-day MA helps identify the short-term trend. If the stock is above the 50-day MA, it suggests short-term bullish momentum. If below, it suggests short-term bearishness.
- **Example:** If GAIL is trading at ₹110 and the 50-day MA is ₹108, it indicates a short-term bullish trend.
- **200-day Moving Average (MA):**
- The 200-day MA is used to identify the long-term trend. If the stock is trading above the 200-day MA, it indicates a long-term bullish trend.
- **Example:** If the stock is at ₹110 and the 200-day MA is ₹105, it confirms a long-term bullish trend.
#### **3. RSI (Relative Strength Index)**
- **RSI Levels:**
- **Above 70:** The stock may be overbought, indicating a potential pullback or consolidation.
- **Below 30:** The stock may be oversold, suggesting a potential upward reversal.
- **Current Example:**
- If the RSI is **above 70**, GAIL may be overbought and could face a price correction.
- If the RSI is **below 30**, GAIL may be oversold, suggesting the stock could bounce upward.
#### **4. MACD (Moving Average Convergence Divergence)**
- **Bullish Signal:** A bullish crossover occurs when the MACD line crosses above the signal line, indicating a potential upward momentum.
- **Bearish Signal:** A bearish crossover occurs when the MACD line crosses below the signal line, indicating a potential downward move.
- **Current Example:**
- If the MACD is above the signal line, this is a bullish signal for GAIL.
- If the MACD is below the signal line, it might indicate that GAIL could face downward pressure.
#### **5. Volume Analysis**
- **Increasing Volume:** A price move with increasing volume indicates strong buying or selling interest and reinforces the current trend.
- **Decreasing Volume:** If the stock rises or falls on decreasing volume, it may indicate weakening momentum.
- **Current Example:**
- If GAIL is rising with increasing volume, it shows strong support for the upward movement.
- If the stock is moving down with increasing volume, it may indicate a strong downtrend.
#### **6. Candlestick Patterns**
- **Bullish Patterns:**
- **Bullish Engulfing**, **Hammer**, and **Morning Star** patterns at key support levels suggest a potential reversal to the upside.
- **Bearish Patterns:**
- **Shooting Star**, **Bearish Engulfing**, and **Evening Star** patterns at key resistance levels signal a potential reversal to the downside.
- **Current Example:**
- If a **Bullish Engulfing** pattern forms near a support level (like ₹100), it could signal a reversal to the upside.
- If a **Shooting Star** forms near a resistance level (like ₹120), it could indicate a potential downward reversal.
#### **7. Fibonacci Retracement Levels**
- **Fibonacci Retracement Levels** help identify potential support and resistance during price retracements. The key levels are **23.6%, 38.2%, 50%, 61.8%**.
- **Current Example:**
- If GAIL has moved from ₹95 to ₹120, you could check the following Fibonacci levels:
- **23.6% retracement** around ₹115
- **38.2% retracement** around ₹110
- **50% retracement** around ₹105
- **61.8% retracement** around ₹102
These levels can act as potential support if the stock pulls back.
---
**Disclaimer:**
- I am not a SEBI-registered professional or licensed financial advisor.
- All analysis, recommendations, and opinions provided are based on historical price data, patterns, and general market trends.
- Any action you take on the basis of this information is at your own risk. Please consult with a licensed financial advisor before making any investment decisions.
- Technical analysis cannot guarantee future results and may not be accurate in predicting market movements.
- Stock prices and market conditions can be influenced by many factors, including external events, news, and economic data, which are beyond the scope of this analysis.

GAIL - Weekly EW Analysis - Long Set-upWeekly 4 seems over with 5 wave down looking complete in C of 4.
Safe to play for 180. Trail for 200, 250.

GAIL - Weekly EW Analysis - Long Set-upWave 4 seems done in WXYXZ. Even if it's a larger W down an X up should unfold.
Good 20% trade from here.
