SBI : VCP Breakout - Positional (1-3 months minimum)#SBI : VCP Breakout
Positional Call (1-3 months minimum)
>> Entry at cmp or at retracement till safe entry levelz
>> Good Volume Buildup
>> Good strength in Stock
>> Swing Traders can book profits at 5-10% or keep trailing
Trgts : It will test the Previous Swing highs
Keep Liking & sharing for more such Learning
Trade ideas

SBIN: Looks Bullish1. Double rounding pattern
2. Fresh Breakout
3. Target as per technical is ATH
4. Breakout confirmed with Banknifty chart

Double bottom & Breakout| SBINsbin stock created double bottom and given breakout
stock giving trending moves in intraday
volume rising

intradayboth side potential
avoid first 15min breakout
wait for 15 min candle closing
targets are marked
follow risk management
do your own analysis
do workout
do meditation
start reading book

SBIN - Rotated triangle SBIN Rotated triangle We can see sbi bank movements between ROTATED TRIANGLE for weekly time frame.
Valid - Till May June 2023.

Watchout for resistance breakoutThe stock has given a trendline breakout and now testing it's strong resistance zone.
Buy above 568 level in intraday tomorrow for 0.7-1% move.
Learn & Earn,
Dr. Tanya Kumar

SBIN swing opportunitySBIN on 2 hour tf is showing a falling wedge pattern, as long as recent swing low ( or budget day low) is saved chances of this going upside are higher and can be a good swing trade with small risk.

SBIN READY FOR BREAKOUT ?SBIN approaching the resistance level maintained since Jan 23. Will SBIN breakout above resistance level? If done then 588.00 TO 614.00 levels likely. Keep watch


SBI Triangle - Breakout or Breakdown?SBI is at a crucial point, breakout or breakdown with volumes of this pattern will decide its long term trend.

State Bank of India (SBIN) - Long, 5% upside target
Inverted Head and Shoulder formation in SBIN on the hourly chart
Previous resistance has turned into support
Rising volume on Green candles
RSI has moved into the bullish zone and is taking support on the upper band
Long entry at can be made at current price with a stop loss at 524 (Risk reward of 1:4, for full upside target)

#SBIN Analysis Stock has retested its major support of 490 levels and again volume build up is seen, very soon ATH may be seen.

consolidation in small rangeboth side potential
avoid first 15min breakout
wait for 15 min candle closing
targets are marked
follow risk management
do your own analysis
do workout
do meditation
start reading book

SBI India Long from support trendlineSBIN Took support from multiyear support trendline and is ready to touch 650+ levels. SL of 40 points for RR 1:3

STATE BANK OF INDIA TARGET 568STATE BANK OF INDIA is under inverse head and shoulder in the intraday chart. 533 is the breaking point for inverse head and shoulder. If it sustains in the day above 533 it will reach the first resistance of 553 and then it will reach 568

Short on SBI chartCMP 542 , Target 450 , Time frame March 2023, Looking at the monthly charts from here we see a doji condle is formed at the upper end of the bollinger band at the January month followed by downtrend on Feb month . Expecting the SBI charts to show downtrend till 450 by March expiry.


#SBINPlease keep in watch list. This stock is taking support multiple times at the same level. Break down of this level will give good momentum


SBI - 1 Hr- Elliott WaveHere is the Elliott wave analysis of SBI on 1 Hr Tf, the following are the inferences.
1. Security is in the downtrend.
2. Wave C is getting completed, major correction is going on.
3. Wave C is generally impulsive in nature, i.e results in sharp correction either time/price-wise.
4. First target already achieved.
5. 2-3 targets marked with fib projections.
It might also change direction for an up-move, but that will be a sell-on-rise opportunity until a proper impulse starts upwards.
Views are personal, only for educational purposes!
Please don't treat this as trading advice.

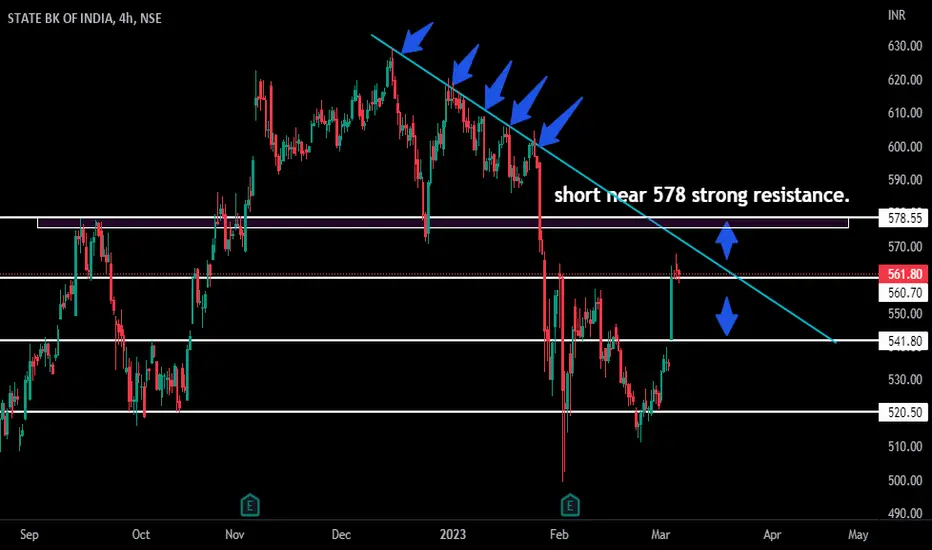
SBIN 1D (20 MARCH 2023)NSE:SBIN
sbin was in downtrend. its falling when it took bounce from bottomtake reverse from fib 50%which 566.35 drawn in the chart.
short near 560 strong resistance.
Strong support level :520
All important levels are drawn in the chart.Work with risk reward ratio. not taking a trade is also a trade.
A trade cant change anything keep in your mind,if you think one trade can change your life then you are doing gambling in the market.take calculated risk.
this is only for educational purpose. before taking trade take advice from your financial advisor.

SBIN 4HR NSE:SBIN
upside more resistance market need more energy to go upside and it may consolidate. if it doesnot sustained above then it will come downside.
SBIN: 560-580 Make or Break zone SBIN
- The stock has seen a nice recovery over the last couple of days rising from the Budget day low of 499.35 to 567.9 today
Observations
- The zone o 560-580 is very important for SBIN
- Black Line of Resistance coincides with Yellow Downtrend Line at around 580 odd levels
- 61.8 Fib retracement level is also at 579.80
Making the current zone all more important.
Bulls need a sustainable price movement above 580 levels for further rally.
If gets resisted then SBIN may resume it's down trend again
On the lower side the Blue Line may be looked at first Line of Support.
My trading strategy
Bear Call Spread strategy.
Exit if SBIN closing above 585 on daily charts.
Take care and Plan your trade accordingly...!!!
Disclaimer
- The view expressed here is my personal view
- Past performance is not a guarantee for future predictions
- Use this for educational purpose
- Any decision you take, you need to take responsibility for the same
- It's your hard earned money. Treat it wisely
- Trade / Invest keeping in mind your trading style, goals and objectives, time horizon & risk tolerance
- if trading in F&O, understand that F&O trading involves risk
- Do take proper risk management measures
- Do your own analysis and consult your financial adviser if need be
