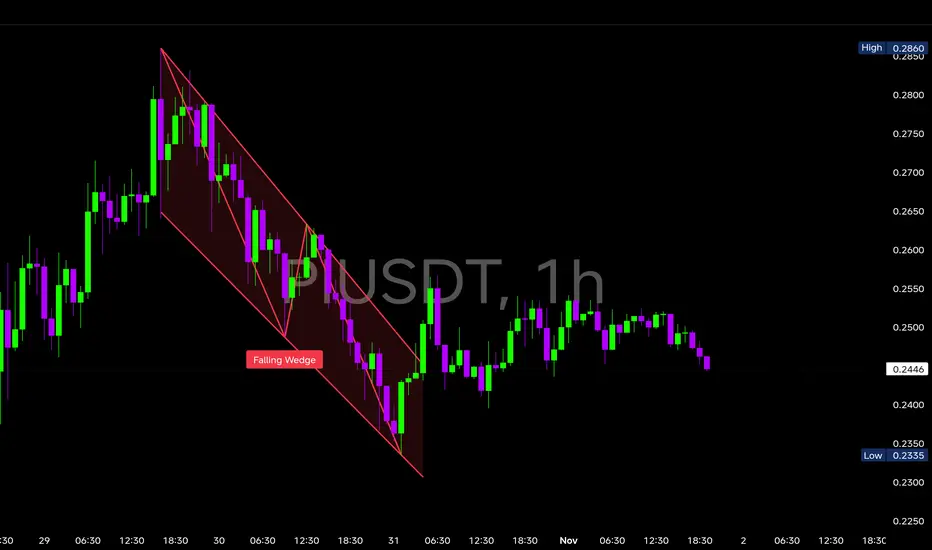
$PI is showing a Falling Wedge on the 1H chart NASDAQ:PI is showing a Falling Wedge on the 1H chart
🔹 Key Support Zones
$0.243 – $0.245: Wedge support zone (critical defense).
$0.235: Extended downside if pattern fails.
🔹 Resistance Zones
$0.252: Wedge breakout level.
$0.260: Next immediate resistance after breakout.
$0.275 – $0.280: T
Related pairs
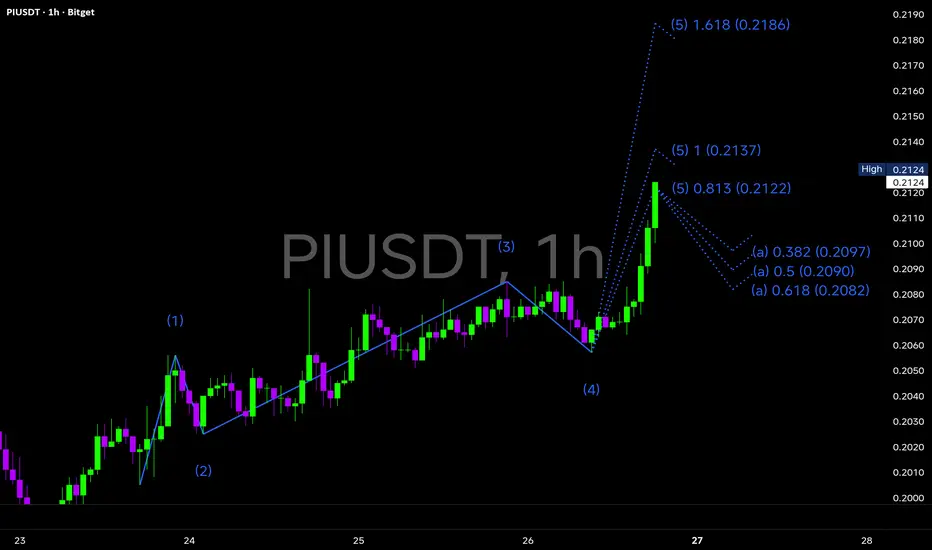
$PI is currently completing its 5-wave impulse structure NASDAQ:PI is currently completing its 5-wave impulse structure on the 1H chart — signaling the end of Wave (4) correction and the start of a potential explosive Wave (5) rally.
The structure clearly shows Wave (1) → (4) formation, with Wave (5) extension now active.
Immediate upside targets lie a
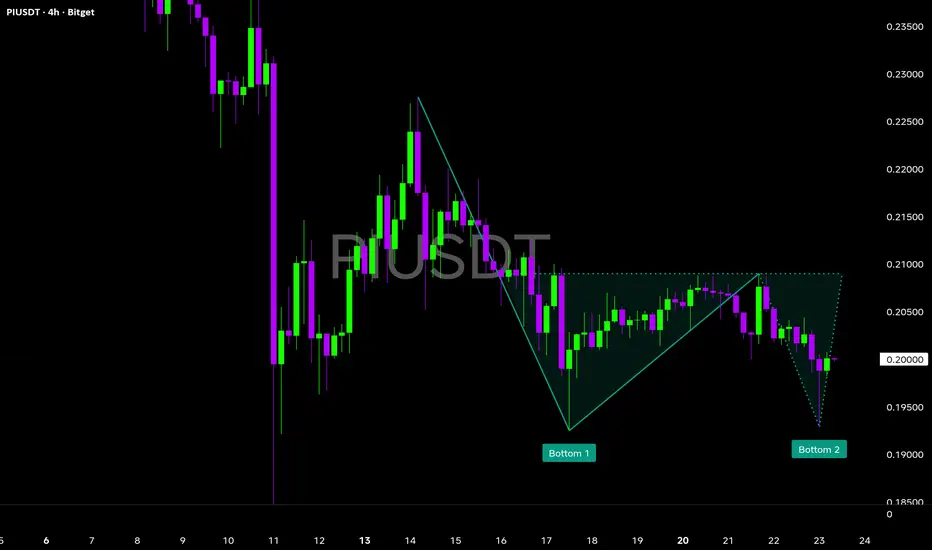
$PI forming a Potential Double Bottom Pattern!NASDAQ:PI forming a Potential Double Bottom Pattern! 📉
#PI is currently testing a crucial reversal zone after completing two symmetric dips near the $0.19–$0.20 support — hinting at a possible double bottom formation.
🔸Bottom 1: Formed near $0.193, marking the first major support test.
🔹Bottom 2
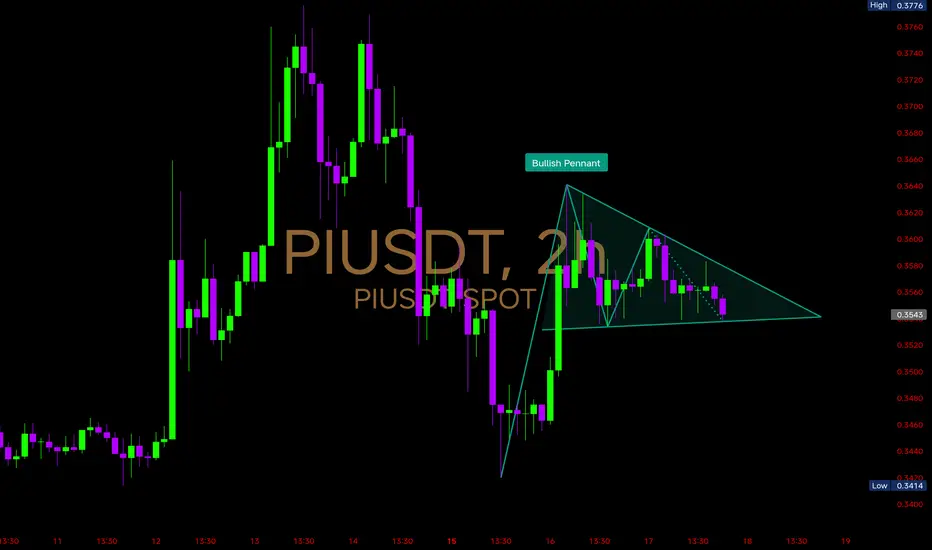
$PI is coiling inside a Bullish PennantNASDAQ:PI is coiling inside a Bullish Pennant, and the next move depends on whether bulls can break through $0.365 🚀
Support Zone: $0.341 – $0.345 (recent low & pennant base)
Resistance Zone: $0.360 – $0.365 (upper pennant trendline)
Breakout Trigger: A clean break above $0.365 could confirm th
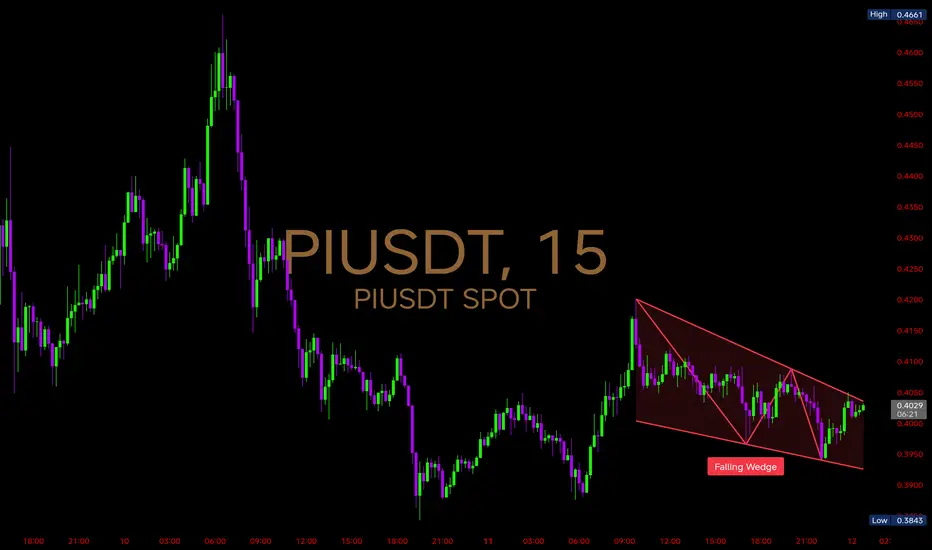
$PI 15mins Chart Analysis NASDAQ:PI 15mins Chart Analysis
Price is currently trading inside a falling wedge — a pattern often seen as a bullish reversal setup when confirmed with a breakout.
🔍 Key Observations:
Price is compressing between lower highs & higher lows within the wedge
Current range: 0.3843 (low) to 0.4050
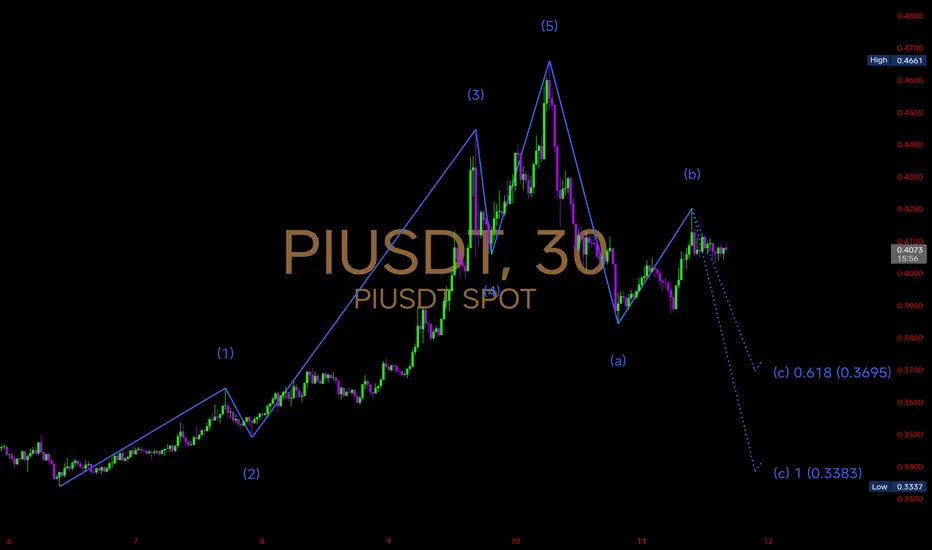
$PI – Elliott Wave Correction Unfolding NASDAQ:PI – Elliott Wave Correction Unfolding
The recent 5-wave impulse topped at 0.4661, marking a strong rally phase ✅.
Now, the structure is shifting into a corrective ABC wave:
Wave (a) completed with a sharp drop
Wave (b) rebound nearing completion around the 0.4100 region
Wave (c) project
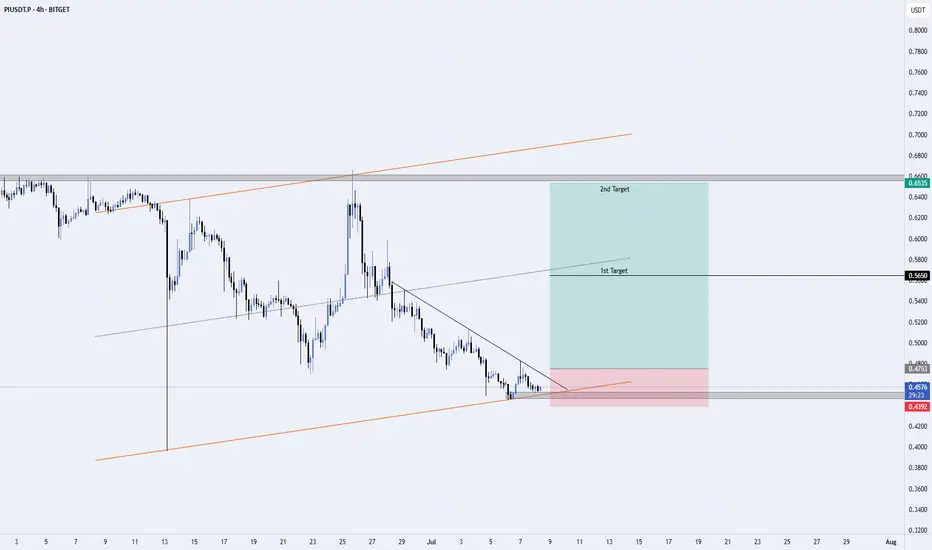
PIUSDT – Potential Long Setup from Ascending Channel Support (4HI’m watching PIUSDT closely as it approaches a significant confluence of technical levels on the 4-hour chart:
🔹 Key Highlights:
Ascending Channel Support: Price is testing the lower boundary of the channel (orange trendline).
Descending Trendline Resistance: Creating a wedge structure—breakout p
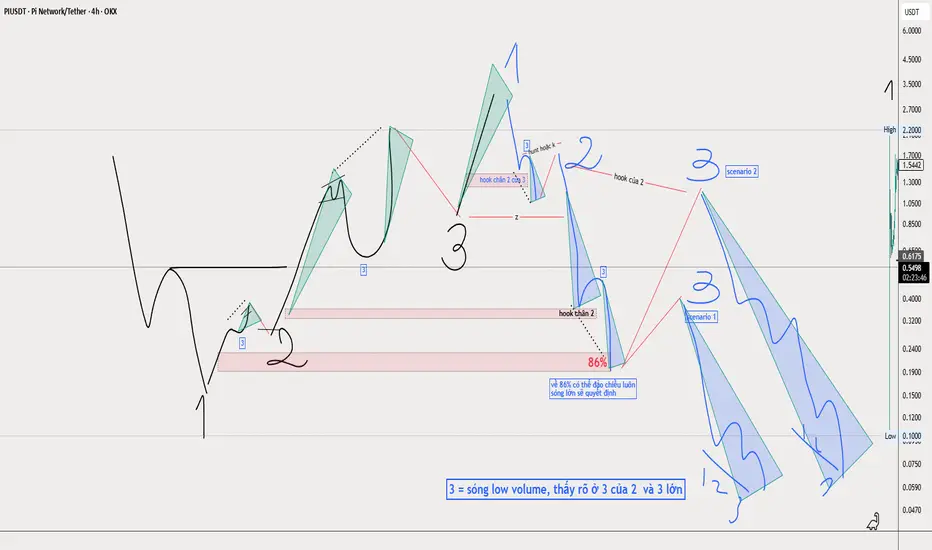
anatomy of hook 123f and counting numbersanatomy of hook and counting number abcs song 123
swing 1 = swing 1 + 2 + small mini low volume 3 of 1
swing 2 = swing 1 + 2 + swing 3 low volume 3 of 2
swing 3 =big low volume
swing 3 low volume = swing low volume continuation 3 +3
after break high/ low that made the swing, count 3 fractal --> hig
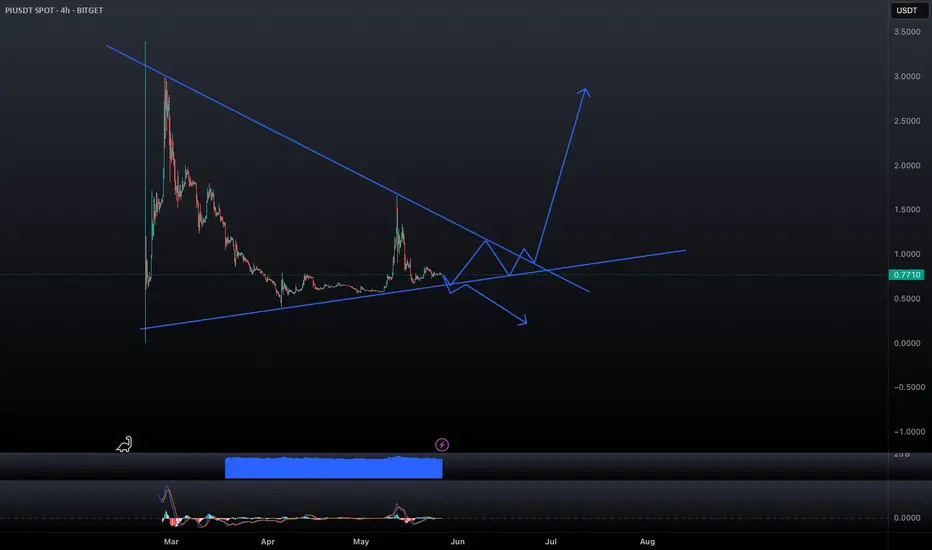
PIUSDT playout testTesting the waters with PIUSDT analysis – still learning the ropes, so this is more of an exploration than expert advice. Watching how Pi Network is pairing up against USDT to understand potential trends, support/resistance levels, and what the market sentiment looks like. Feedback and tips welcome
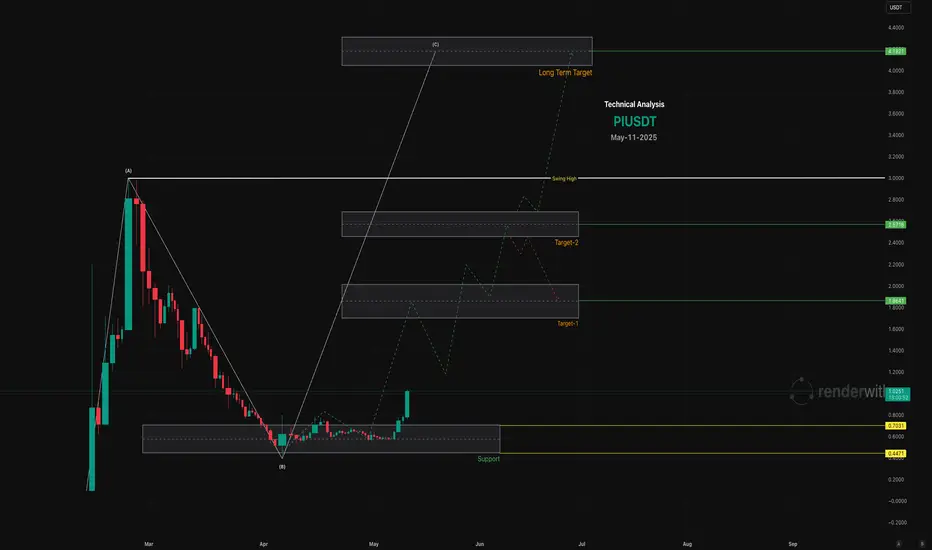
PI Network Can Touch $4 In This Bull Run
Support: Key support levels are at $0.5192, $0.5465, and potentially $0.40 (all-time low) if selling pressure persists.
Resistance: Immediate resistance is at $1.7000, $2.000, A break above $1.70 would signal a strong bullish reversal.
Psychological Levels: $2.00 is a critical psychological barri
See all ideas
Summarizing what the indicators are suggesting.
Oscillators
Neutral
SellBuy
Strong sellStrong buy
Strong sellSellNeutralBuyStrong buy
Oscillators
Neutral
SellBuy
Strong sellStrong buy
Strong sellSellNeutralBuyStrong buy
Summary
Neutral
SellBuy
Strong sellStrong buy
Strong sellSellNeutralBuyStrong buy
Summary
Neutral
SellBuy
Strong sellStrong buy
Strong sellSellNeutralBuyStrong buy
Summary
Neutral
SellBuy
Strong sellStrong buy
Strong sellSellNeutralBuyStrong buy
Moving Averages
Neutral
SellBuy
Strong sellStrong buy
Strong sellSellNeutralBuyStrong buy
Moving Averages
Neutral
SellBuy
Strong sellStrong buy
Strong sellSellNeutralBuyStrong buy
Frequently Asked Questions
The current price of Pi Network/Tether (PI) is 0.22561 USDT — it has fallen −1.37% in the past 24 hours. Try placing this info into the context by checking out what coins are also gaining and losing at the moment and seeing PI price chart.
Pi Network/Tether price has fallen by −0.01% over the last week, its month performance shows a 13.18% increase, and as for the last year, Pi Network/Tether has increased by 360.43%. See more dynamics on PI price chart.
Keep track of coins' changes with our Crypto Coins Heatmap.
Keep track of coins' changes with our Crypto Coins Heatmap.
The safest choice when buying PI is to go to a well-known crypto exchange. Some of the popular names are Binance, Coinbase, Kraken. But you'll have to find a reliable broker and create an account first. You can trade PI right from TradingView charts — just choose a broker and connect to your account.
Crypto markets are famous for their volatility, so one should study all the available stats before adding crypto assets to their portfolio. Very often it's technical analysis that comes in handy. We prepared technical ratings for Pi Network/Tether (PI): today its technical analysis shows the sell signal, and according to the 1 week rating PI shows the sell signal. And you'd better dig deeper and study 1 month rating too — it's strong sell. Find inspiration in Pi Network/Tether trading ideas and keep track of what's moving crypto markets with our crypto news feed.
Pi Network/Tether (PI) is just as reliable as any other crypto asset — this corner of the world market is highly volatile. Today, for instance, Pi Network/Tether is estimated as 2.14% volatile. The only thing it means is that you must prepare and examine all available information before making a decision. And if you're not sure about Pi Network/Tether, you can find more inspiration in our curated watchlists.
You can discuss Pi Network/Tether (PI) with other users in our public chats, Minds or in the comments to Ideas.