

Feb Retractment#QKC
QKC chart with feb-retractment and RSI hope so Feb is correct Suggestion are welcome


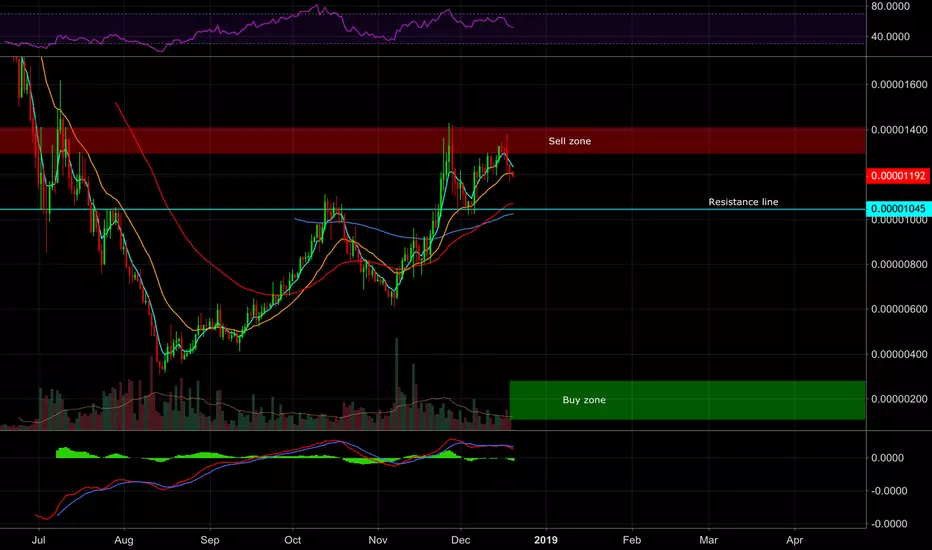
Buy / Sell zones for QKC based on 1.414-1.618 Fib extensionFlipped the chart upside down with OPTION-I then marked the 1.414-1.618 fib extension from resistance line to "peak" (when viewed upside down). This region is the buy zone.
QKCBTC Latest Technical Analysis 45% Target projectionRight Its Look like that its holding Trend line support Area .
With the help of S&R We have find some targets and Stop loss Area
I have Mention Support and resistance levels on Chart
Note: This is only for Educational Purpose this is not an Investment advice.
Please support the setup with your

QKC/BTC4th wave is coming down and there is a support zone and a fib level also
buy between 810-790
follow me on twitter i gave signals there also twitter.com


See all ideas
Displays a symbol's price movements over previous years to identify recurring trends.