Key stats
Related pairs

Institutional Trading Win: Big Money Dominates Financial MarketsIntroduction: Understanding Institutional Trading Power
Institutional trading refers to market activity conducted by large organizations such as mutual funds, hedge funds, pension funds, insurance companies, investment banks, and sovereign wealth funds. These institutions control massive pools of c

Part 3 Learn Institutional Trading Why Do People Trade Options?
Traders use options for three main reasons:
a) Hedging
To protect their portfolios from losses.
Example: If you own shares and fear a price drop, you can buy put options to act as insurance.
b) Speculation
To profit from price movements using small capital.
Options

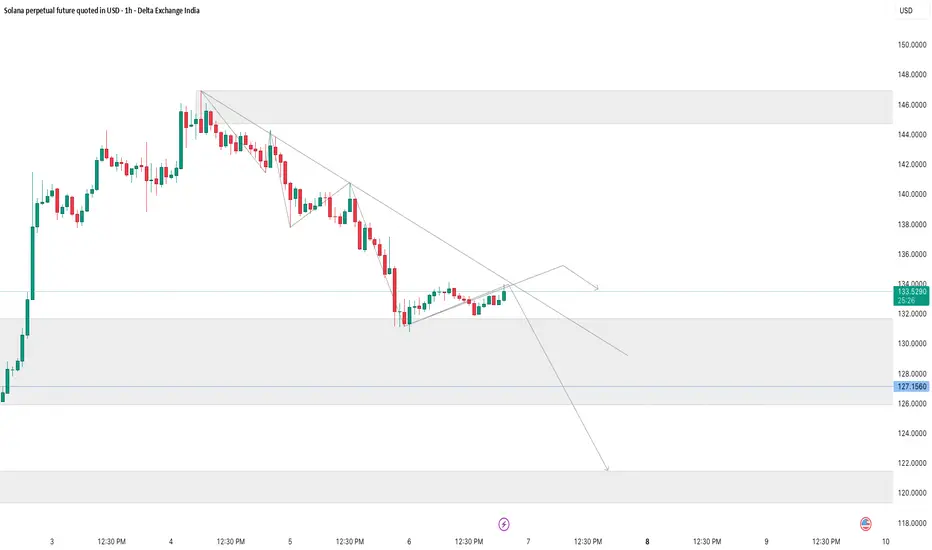
SOL | Descending Trendline Retest – Possible Pullback Toward DemSolana (SOL) is currently trading under a strong descending trendline on the 1H timeframe.
Price has made a minor recovery and is retesting the trendline from below, indicating a potential lower-high formation.
Key Observations
Price is respecting a clear downtrend structure.
Currently near a tre
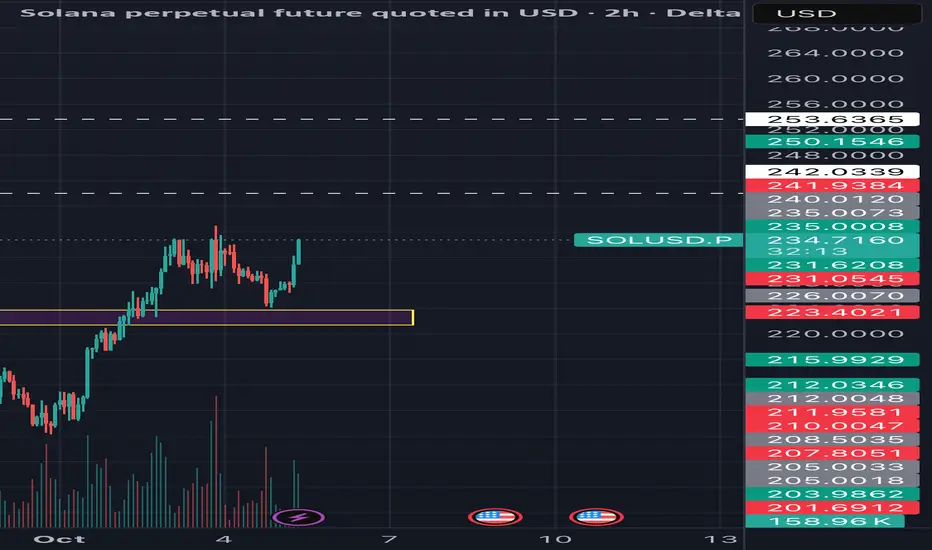
SOLUSD COMPLETE TRADING PLAN (BUY, SELL, NO-TRADE ZONES)PRICE IS CURRENTLY INSIDE A SUPPLY / SELL ZONE
The light-blue highlighted area is a strong supply zone between:
🔵 Supply Zone (Sell Zone)
146.00 – 149.00
Price has tapped this zone 3 times → weakness for buyers → sellers may take control.
🚫 NO-TRADE ZONE (RIGHT NOW)
The region where price is s

Solana ready to Rise till 160It has crossed weekly hurdle of 140 and now it will consolidate till 134, than jump further till 160-170 for next 10-15 points consolidation

SOL DUMP TO THE $40YES, YOU SEEN RIGHT
CRYPTO:SOLUSD
SOL ready with multiple negative patterns.
1. all time resistance
2. triple top
3. cup and handle failure
First pattern is already activated and triple top near to active.
Reverse scenario
take support from major strong support. cup and handle breakout
🧠 Alwa

FVG Retracement in a Downtrend📈 Solana Chart – Fair Value Gap Retracement in a Bearish Market Structure
This chart highlights a clear bearish sequence, defined by a repeated formation of Lower Highs (LH) and Lower Lows (LL) with some Higher Highs (HH) and Higher Lows (HL). Throughout this downtrend, multiple Fair Value Gaps (

SOLUSD TRADING LEVELSTrading Levels for SOLUSD
Anyone can Trade on both sides (as per levels). WITH STRICT SL.
Levels shared on chart

Breakout Play: Demand Zone Reversal with High R:R TargetOverview :
This idea focuses on a breakout trade for Solana (SOLUSD), leveraging recent price action and volume signals at a key demand zone. The setup is designed for a high risk-to-reward ratio based on technical structure and confirmation tools.
Trade Setup & Logic:
• Entry: Price retraced to
See all ideas
Displays a symbol's price movements over previous years to identify recurring trends.
Frequently Asked Questions
SOLANA (SOL) reached its highest price on Jan 20, 2025 — it amounted to 272.99 USD. Find more insights on the SOL price chart.
See the list of crypto gainers and choose what best fits your strategy.
See the list of crypto gainers and choose what best fits your strategy.
SOLANA (SOL) reached the lowest price of 0.87 USD on Jul 21, 2020. View more SOLANA dynamics on the price chart.
See the list of crypto losers to find unexpected opportunities.
See the list of crypto losers to find unexpected opportunities.
The safest choice when buying SOL is to go to a well-known crypto exchange. Some of the popular names are Binance, Coinbase, Kraken. But you'll have to find a reliable broker and create an account first. You can trade SOL right from TradingView charts — just choose a broker and connect to your account.
You can discuss SOLANA (SOL) with other users in our public chats, Minds or in the comments to Ideas.