Solana elliot wave analysis 1. Primary Wave Structure Breakdown
* Cycle Wave I (Grand Supercycle/Primary Bull Wave): Dec 2022 low up to the November 2024 / January 2025 peak ($293–$295 ATH region).
* Cycle Wave II (Corrective Phase): An ABC Irregular (Expanded) Flat correction following the peak.
* Wave A: Initial sharp d
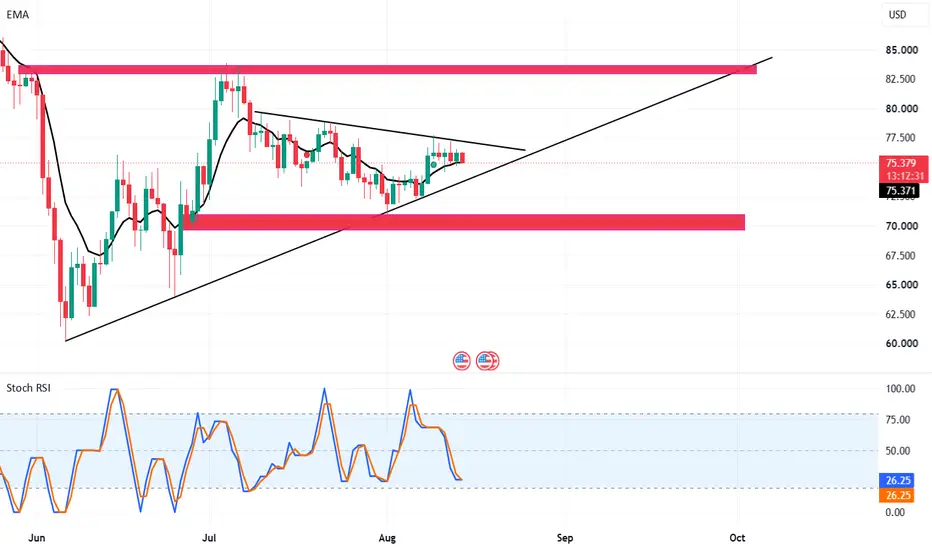
SOL: Wave (4) Correction Toward $95?Solana (SOL) on the daily timeframe appears to be undergoing a corrective phase after completing a strong five wave impulsive advance within a rising parallel channel. The Elliott Wave structure suggests that wave (1) topped near $76.02 , followed by a correction to $63.97 in wave (2), before SOL
SOLUSD | $140 NEXT? | SWING TRADE SETUPSOLUSD | $140 NEXT? 🟢📈
LONG SETUP — BREAKOUT & RETEST
📍 Entry: $120+ after breakout confirmation
🎯 TP1: $123
🎯 TP2: $132
🎯 TP3: $140
🛡️ SL: $110
Bias: Bullish 🟢
SOLUSD is approaching the $119–$120 resistance zone. A confirmed breakout and successful retest of $120 as support could open the path
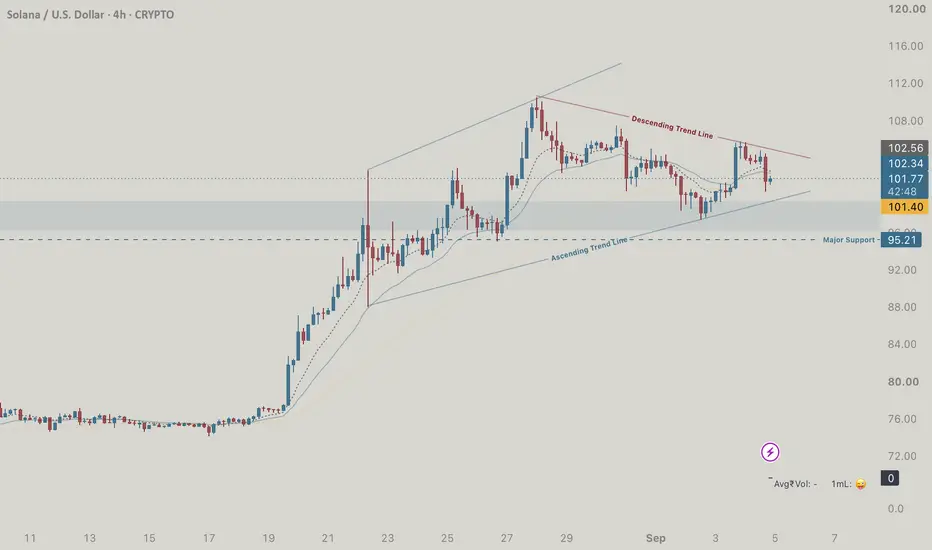
SOLUSDT Chart Analysis 4HSolana (SOL/USD) is trading at $101.68, down -2.16% as it undergoes structural consolidation inside a Symmetrical Triangle Pattern on the 4-hour chart.Here are the 3 key takeaways from the chart analysis:Squeezing Price Action: The asset is locked between a clear Descending Trend Line capped at the
solana bottom conifirmed???Recently, solana has witnessed decent bounce from its recent low near 60-61. many of traders are assuming that low has been made and solana is ready to boom. But, reality is Quite different.
please consider following points:
1)As, bitcoin got trapped between 62000-65000, alt coins loosing its moti
Monetizing a Probable Dead-Cat Bounce [Swing Opportunity]Probable Scenario Analysis for Swing Opportunity (Long) in CRYPTO:SOLUSD .
🟡 Present Scenario:
The long-term trend of Solana CRYPTO:SOLUSD is bearish. However, the monthly and weekly timeframe suggests that the price is losing bearish momentum and there is a higher probability of a reversa
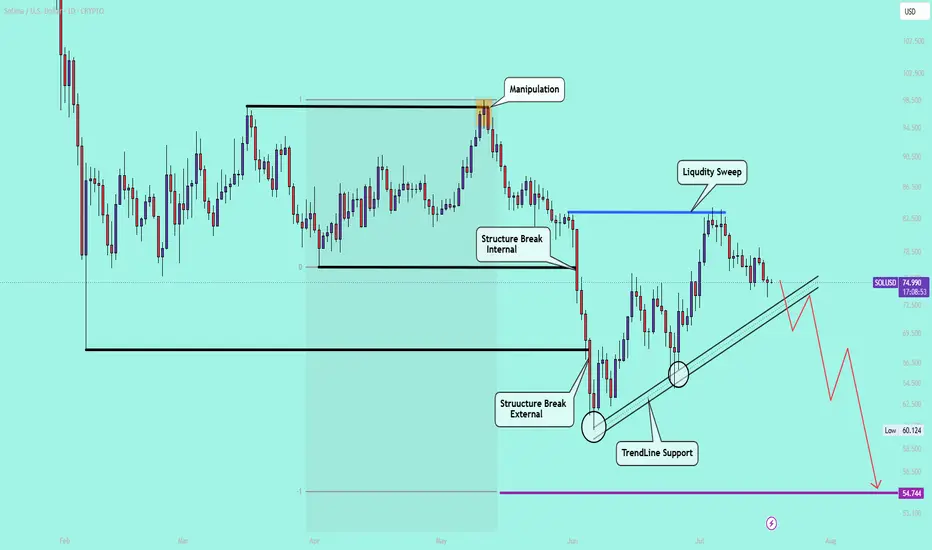
SOLUSD(Crypto) Looks Weak - Expect Down Side !SOLUSD - As per Technical , Day time frame Looks Bearish Expansion.
Previous Swing Low was Broked and Close Strongly.
Now Retracement (correction towards - Fib Level of 50% - 60% )
At the fib level meets also a previous minor swing , and its Liq Sweep Happened.
Once the Trendline support shou
Make Wealth through SOLUSD: Limited Risk- Highest Gain
SOLUSD Progressive Buying Strategy – Risk vs Reward
Assumption: Client buys 1 SOL at each support level as price falls. Maximum loss assumes SOL falls to $0 after purchases. Profits are cumulative based on total holdings if exited at each resistance.
• Stage 1: Buy 1 SOL at $80.23. Maximum possib
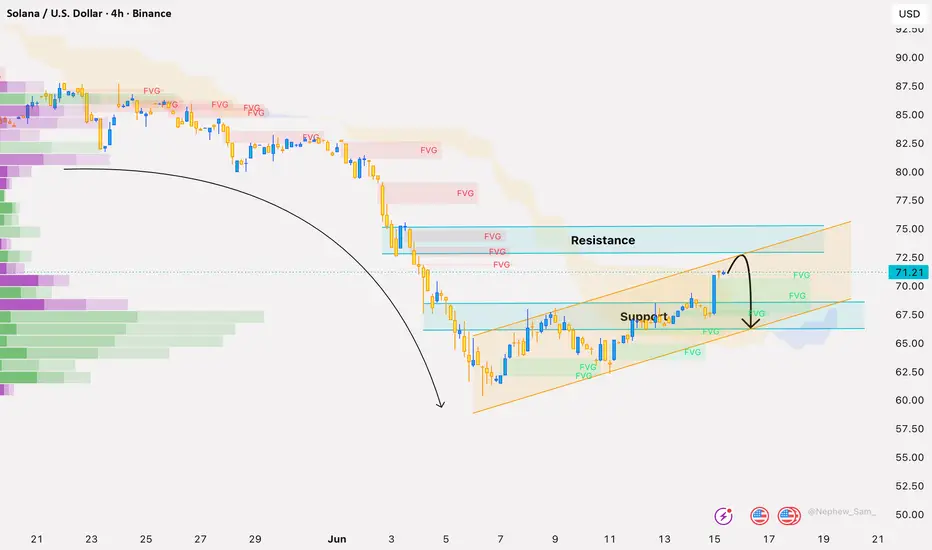
Solana Recovery Builds, But $72 Remains the Key BarrierSolana is starting to show better buying interest after weeks of weakness. The move from the $61–62 area has been gradual rather than aggressive, which suggests buyers are trying to build a stronger base.
For crypto traders, broader market sentiment still matters. If risk appetite improves and liqu
See all ideas
Summarizing what the indicators are suggesting.
Oscillators
Neutral
Oscillators
Neutral
Summary
Neutral
Summary
Neutral
Summary
Neutral
Moving Averages
Neutral
Moving Averages
Neutral
Displays a symbol's price movements over previous years to identify recurring trends.