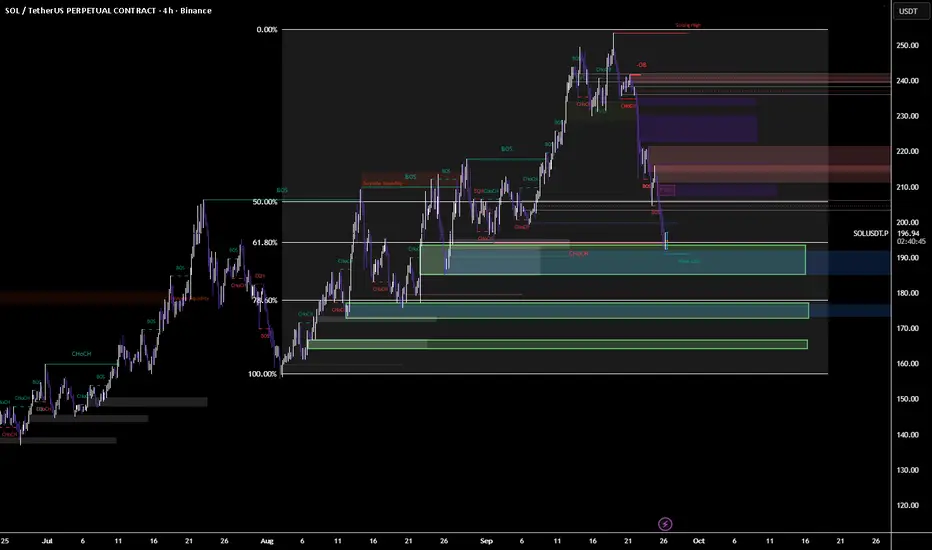
Solana Price Forecast | SOLUSDT Market OutlookSOLUSDT has completed a strong upward cycle and is now unwinding through a structured retracement. This phase is not showing disorderly selling but rather a controlled reset, where liquidity is being cleared to prepare for the next expansion.
The chart reflects a market that is cycling through accu
Related pairs

SOL Ready TO Ignite from Demand - Eyeing $240 Supply “SOL Ready to Ignite from Demand – Eyeing $240 Supply”
📌 Description:
Solana swept liquidity into the $192–195 demand zone and is showing signs of strength. As long as $185 holds, bulls may drive price into the $210–240 supply zones. First target sits at $210 (FVG close), with higher objectives at
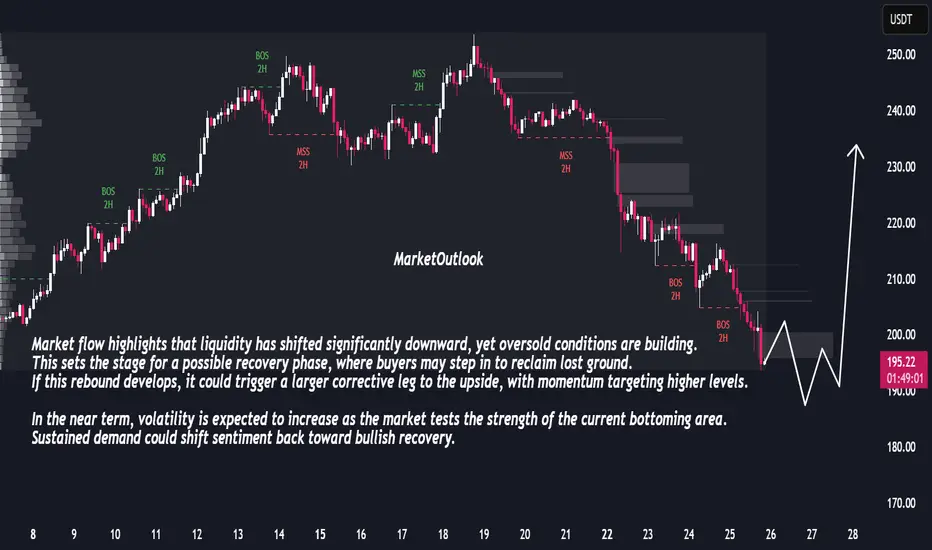
Bullish Reversal Ahead: Market Prepares for Sharp RecoveryThe market has been under consistent selling pressure, with a clear sequence of bearish breaks in structure confirming downside control. Price has now entered a zone where momentum shows signs of slowing, suggesting potential exhaustion in the recent decline. The sharp extension lower indicates that
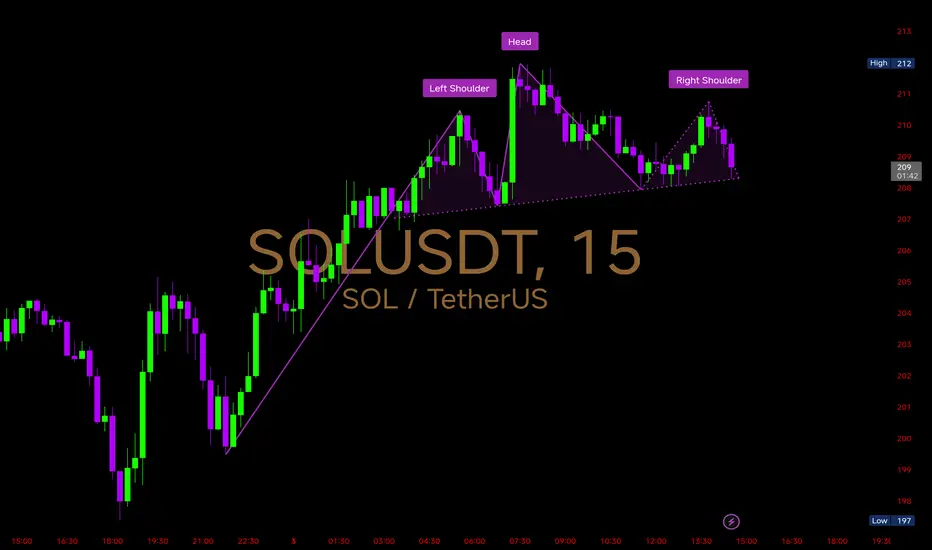
$SOL 15mins Chart Analysis CRYPTOCAP:SOL 15mins Chart Analysis
A Head & Shoulders pattern has formed with the left shoulder near 210, head at 212, and right shoulder around 211.
Key Technical Levels
Neckline Support: Around 208 – if this breaks decisively, we could see stronger bearish momentum.
Immediate Resistance: 2
Solana BUY nowSonala so good to buy
Fibonaci indicator
Top 10 coin crypto market cap has been sizeway a long time. And now run to pamp
Buy and wating 281$ to sell.
Good luck all!

Sol 1 Pending Market Crash so wait for thisSol 1 Pending Market Crash so wait for this
Sol 1 Pending Market Crash so wait for thisSol 1 Pending Market Crash so wait for thisSol 1 Pending Market Crash so wait for thisSol 1 Pending Market Crash so wait for thisSol 1 Pending Market Crash so wait for thisSol 1 Pending Market Crash so wait for th
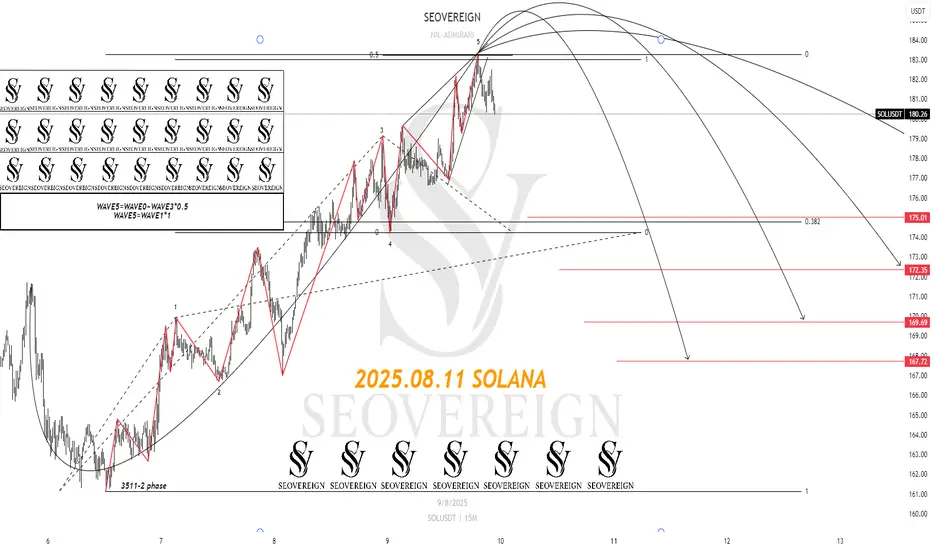
[SeoVereign] SOLANA BULLISH Outlook – August 11, 2025Recently, Solana’s price movement has been showing a very classic Elliott Wave pattern.
Based on this, I would like to present a bearish outlook this time.
The basis for this idea is as follows:
Wave 5 = 50% of the length of Waves 0–3
Wave 5 = equal length to Wave 1 (1:1 ratio)
In addition, the
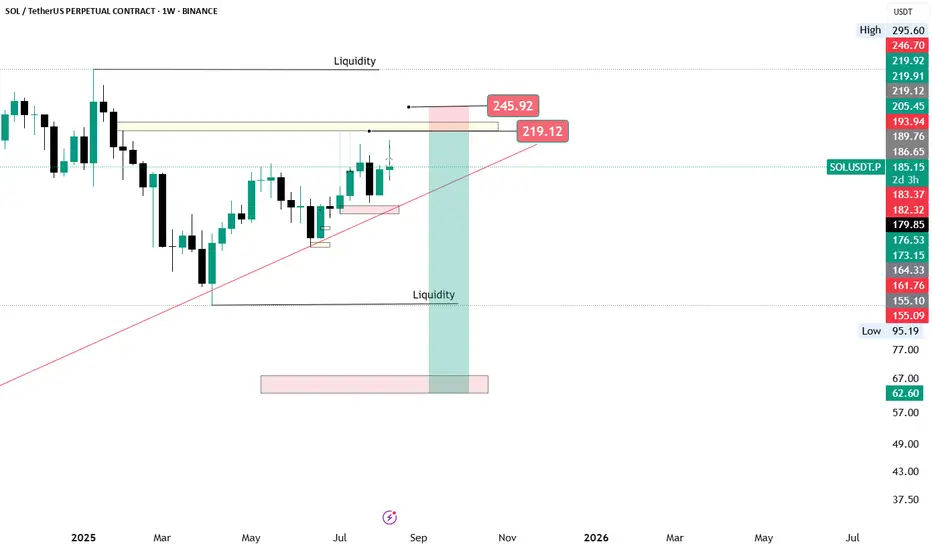
SOL/USDT weekly chart1. Price Structure & Break of Structure (BOS)
• The chart shows a clear break of structure:
• Price has broken above the previous lower high formed during the last downtrend (~$170–$175 zone).
• This suggests a shift from bearish to bullish market structure on the weekly timeframe.
• Current pri

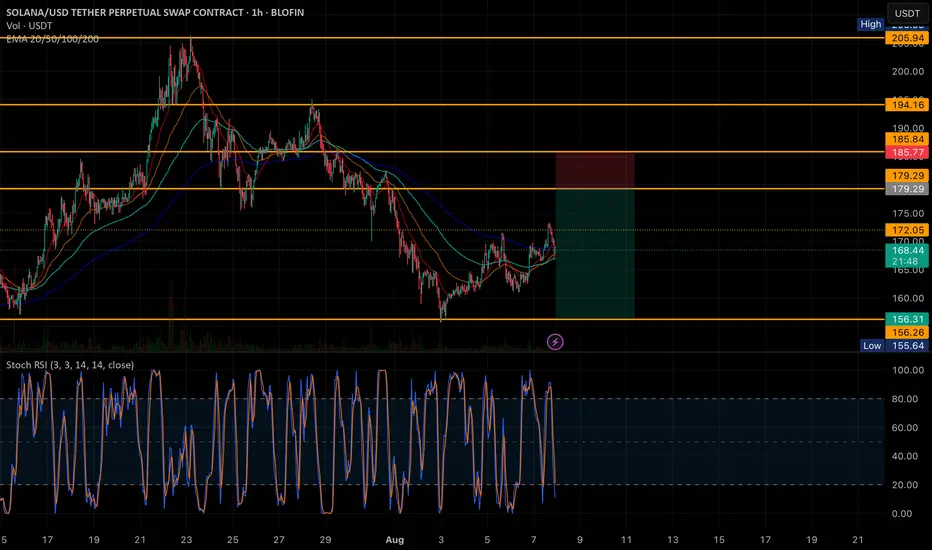
SOLANA CHART For shorts📉 SOL/USDT - Short Setup (1H TF)
Price has tapped into a significant resistance zone around $179–$185, where it faced immediate rejection. This zone aligns with multiple supply levels and previous price reaction areas. The current rejection hints at a possible short-term reversal or retracement.
🔻
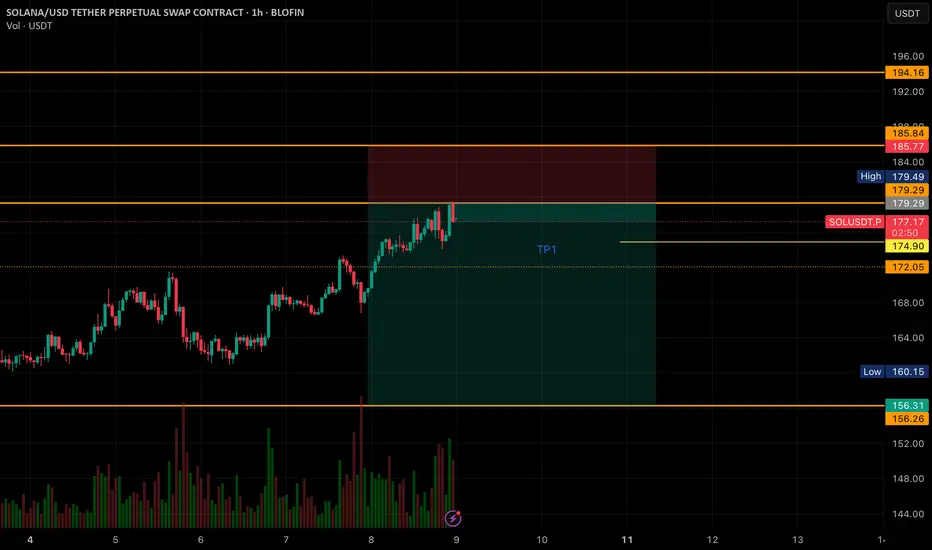
Sol short chartExpecting some upside move on Sol if holds this level.
But Sol need to break first 172 level
I will dca this trade from 172
See all ideas
Summarizing what the indicators are suggesting.
Oscillators
Neutral
SellBuy
Strong sellStrong buy
Strong sellSellNeutralBuyStrong buy
Oscillators
Neutral
SellBuy
Strong sellStrong buy
Strong sellSellNeutralBuyStrong buy
Summary
Neutral
SellBuy
Strong sellStrong buy
Strong sellSellNeutralBuyStrong buy
Summary
Neutral
SellBuy
Strong sellStrong buy
Strong sellSellNeutralBuyStrong buy
Summary
Neutral
SellBuy
Strong sellStrong buy
Strong sellSellNeutralBuyStrong buy
Moving Averages
Neutral
SellBuy
Strong sellStrong buy
Strong sellSellNeutralBuyStrong buy
Moving Averages
Neutral
SellBuy
Strong sellStrong buy
Strong sellSellNeutralBuyStrong buy
Frequently Asked Questions
The current price of SOL5xLong/Tether (SOL) is 0.3751 USDT — it has fallen −12.43% in the past 24 hours. Try placing this info into the context by checking out what coins are also gaining and losing at the moment and seeing SOL price chart.
SOL5xLong/Tether price has fallen by −68.78% over the last week, its month performance shows a −56.72% decrease, and as for the last year, SOL5xLong/Tether has decreased by −63.34%. See more dynamics on SOL price chart.
Keep track of coins' changes with our Crypto Coins Heatmap.
Keep track of coins' changes with our Crypto Coins Heatmap.
SOL5xLong/Tether (SOL) reached its highest price on May 13, 2025 — it amounted to 2.1183 USDT. Find more insights on the SOL price chart.
See the list of crypto gainers and choose what best fits your strategy.
See the list of crypto gainers and choose what best fits your strategy.
SOL5xLong/Tether (SOL) reached the lowest price of 0.1281 USDT on Apr 7, 2025. View more SOL5xLong/Tether dynamics on the price chart.
See the list of crypto losers to find unexpected opportunities.
See the list of crypto losers to find unexpected opportunities.
The safest choice when buying SOL is to go to a well-known crypto exchange. Some of the popular names are Binance, Coinbase, Kraken. But you'll have to find a reliable broker and create an account first. You can trade SOL right from TradingView charts — just choose a broker and connect to your account.
SOL5xLong/Tether (SOL) is just as reliable as any other crypto asset — this corner of the world market is highly volatile. Today, for instance, SOL5xLong/Tether is estimated as 23.50% volatile. The only thing it means is that you must prepare and examine all available information before making a decision. And if you're not sure about SOL5xLong/Tether, you can find more inspiration in our curated watchlists.
You can discuss SOL5xLong/Tether (SOL) with other users in our public chats, Minds or in the comments to Ideas.