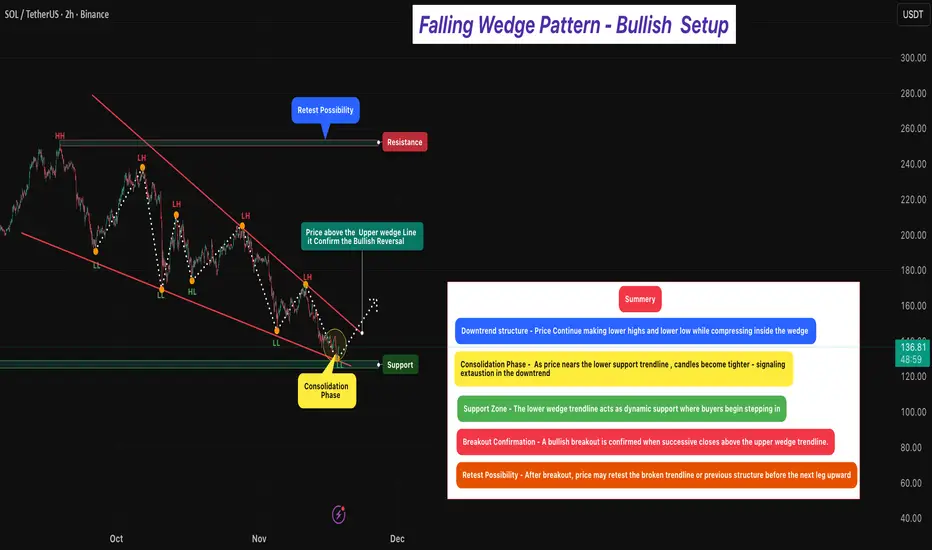
Falling Wedge Pattern - Bullish Setup 🔎 Overview [ /b]
The Falling Wedge Pattern is a bullish reversal setup that forms when price trades inside a narrowing downward channel — creating lower highs and lower lows that converge toward the bottom.
It typically appears after a downtrend, signaling that selling pressure is weakening and
Related pairs
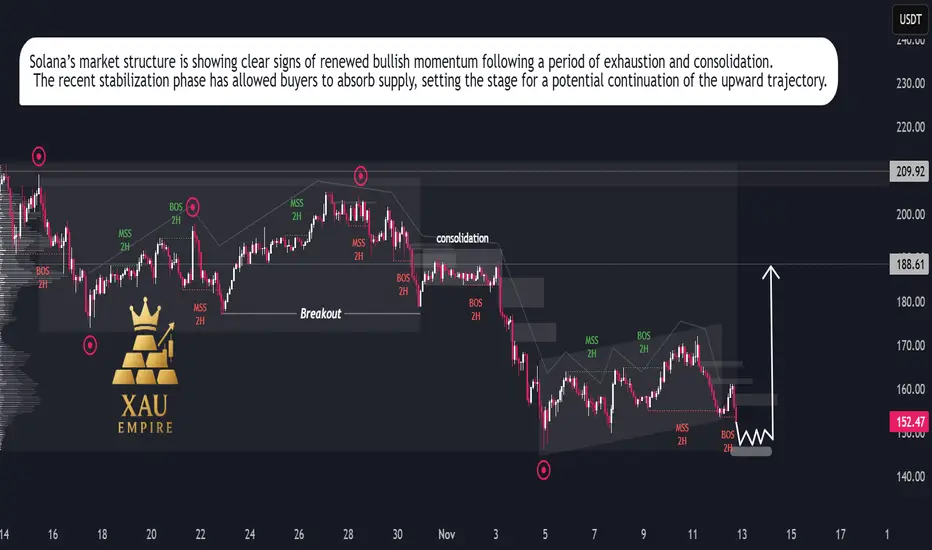
SOL/USDT – Bullish Momentum Rising, Rally Setup in ProgressSolana is showing renewed strength after an extended corrective phase, suggesting that the recent slowdown was a temporary reaccumulation rather than the start of a new downtrend. Price action has begun to stabilize, reflecting growing investor confidence and increasing participation from buyers at
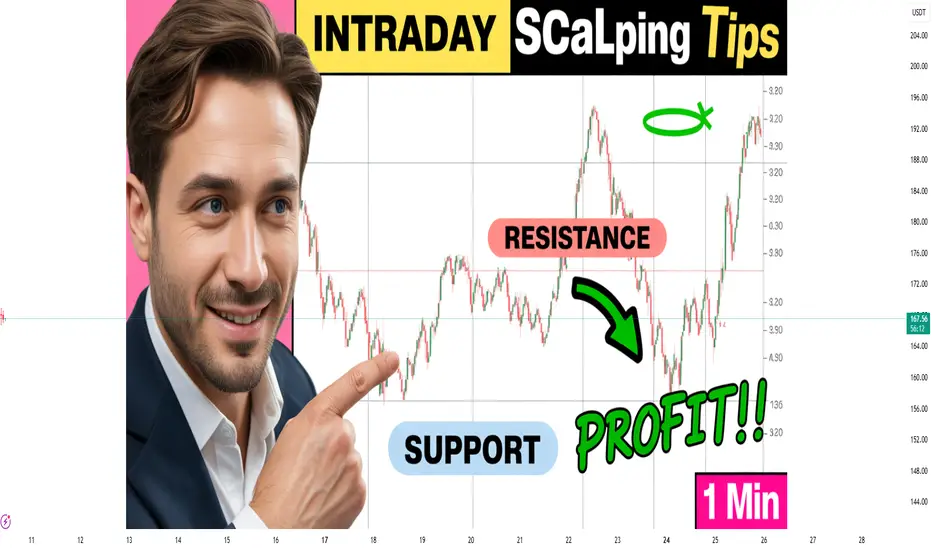
Intraday Scalping Tips: Mastering the Art of Fast Profits1. What Is Intraday Scalping?
Scalping is a subset of intraday trading, but with a much shorter time frame. Instead of holding trades for hours, scalpers enter and exit positions within seconds or minutes. The goal is to capture tiny price movements, often ranging from 0.1% to 0.5%, multiple times
SOLUSDT is in very crucial and discount price currently.. SOLUSDT is in very crucial and discount price currently..
it's supply is about to end and also coming to grab lliquidities.. then it may be fly

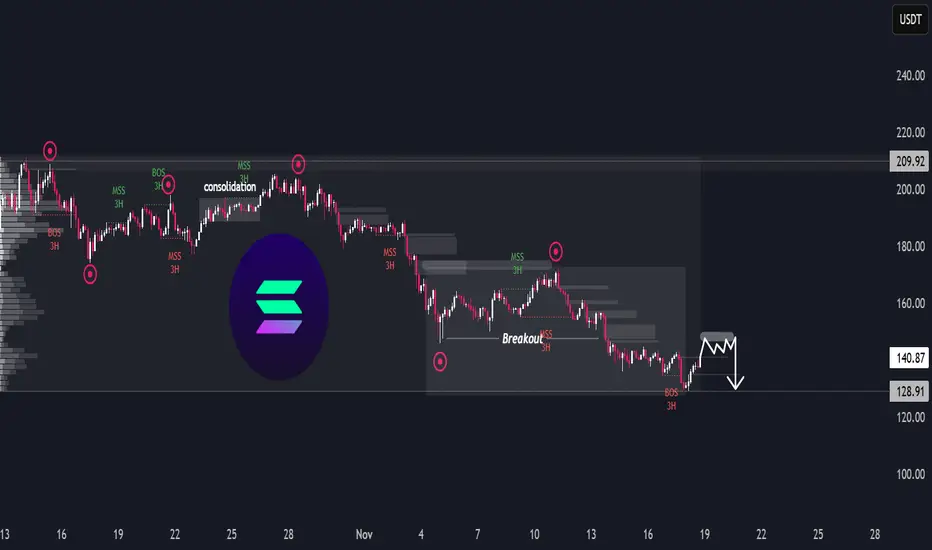
SOL/USDT – Downside LoadingSOL/USDT – Downside Loading
The chart shows a prolonged distribution phase followed by a steady macro decline, with multiple structure breaks confirming a persistent bearish flow. After the earlier consolidation in the upper range, each attempt to reclaim previous highs has been met with a shift i
Solana Price Action Turns BearishSolana’s market structure shows a gradual weakening of bullish momentum after an extended upward phase earlier in the month. The asset experienced a breakout that temporarily fueled optimism among traders, but recent sessions indicate a loss of strength as sellers began to dominate. The volume profi

Part 1 Master Candle Stick PatternOption trading is a popular part of the financial market that allows investors to buy or sell the right—but not the obligation—to trade a stock or asset at a specific price within a certain time period. It’s a flexible and powerful tool used by traders to make profits, hedge risks, or plan future in

SOL/USDT (1H timeframe)...SOL/USDT (1H timeframe):
Here’s a clear technical breakdown 👇
🧭 Chart Overview:
Current price: around $200.40
Trend: Uptrend, but showing short-term pullback
Support area: $190 – $195
Resistance area: $205 – $210
🔍 Key Observations:
The ascending trendline is acting as dynamic support.
Pri

$SOL is showing a classic Head & Shoulders formation on the 1HrCRYPTOCAP:SOL is showing a classic Head & Shoulders formation on the 1-hour chart, a potential early signal of a short-term trend reversal if neckline support gives way.
🔸Left Shoulder: around $198
🔹Head (Peak): near $205
🔸Right Shoulder: formed close to $202
🔹Neckline Support: currently at $19

Part 7 Trading Master ClassOption Greeks: Measuring Sensitivity
Professional traders use “Greeks” to assess how option prices change with market variables:
Delta (Δ): Measures the rate of change in option price relative to the underlying asset’s price.
Gamma (Γ): Measures how Delta changes with price movement.
Theta (Θ):

See all ideas
Summarizing what the indicators are suggesting.
Oscillators
Neutral
SellBuy
Strong sellStrong buy
Strong sellSellNeutralBuyStrong buy
Oscillators
Neutral
SellBuy
Strong sellStrong buy
Strong sellSellNeutralBuyStrong buy
Summary
Neutral
SellBuy
Strong sellStrong buy
Strong sellSellNeutralBuyStrong buy
Summary
Neutral
SellBuy
Strong sellStrong buy
Strong sellSellNeutralBuyStrong buy
Summary
Neutral
SellBuy
Strong sellStrong buy
Strong sellSellNeutralBuyStrong buy
Moving Averages
Neutral
SellBuy
Strong sellStrong buy
Strong sellSellNeutralBuyStrong buy
Moving Averages
Neutral
SellBuy
Strong sellStrong buy
Strong sellSellNeutralBuyStrong buy
Frequently Asked Questions
The current price of SOL5xShort/Tether (SOL) is 1.4467 USDT — it has fallen −6.05% in the past 24 hours. Try placing this info into the context by checking out what coins are also gaining and losing at the moment and seeing SOL price chart.
SOL5xShort/Tether price has risen by 25.24% over the last week, its month performance shows a 266.05% increase, and as for the last year, SOL5xShort/Tether has increased by 43.34%. See more dynamics on SOL price chart.
Keep track of coins' changes with our Crypto Coins Heatmap.
Keep track of coins' changes with our Crypto Coins Heatmap.
SOL5xShort/Tether (SOL) reached its highest price on Aug 19, 2025 — it amounted to 4.4564 USDT. Find more insights on the SOL price chart.
See the list of crypto gainers and choose what best fits your strategy.
See the list of crypto gainers and choose what best fits your strategy.
SOL5xShort/Tether (SOL) reached the lowest price of 0.0022 USDT on Aug 14, 2025. View more SOL5xShort/Tether dynamics on the price chart.
See the list of crypto losers to find unexpected opportunities.
See the list of crypto losers to find unexpected opportunities.
The safest choice when buying SOL is to go to a well-known crypto exchange. Some of the popular names are Binance, Coinbase, Kraken. But you'll have to find a reliable broker and create an account first. You can trade SOL right from TradingView charts — just choose a broker and connect to your account.
SOL5xShort/Tether (SOL) is just as reliable as any other crypto asset — this corner of the world market is highly volatile. Today, for instance, SOL5xShort/Tether is estimated as 19.90% volatile. The only thing it means is that you must prepare and examine all available information before making a decision. And if you're not sure about SOL5xShort/Tether, you can find more inspiration in our curated watchlists.
You can discuss SOL5xShort/Tether (SOL) with other users in our public chats, Minds or in the comments to Ideas.