SOL Buyers Have a Second ChanceHello Traders! 👋
SOL has already delivered the expansion. After breaking out of its previous consolidation, price pushed toward $120 and confirmed that buyers are still active on the daily chart.
The $107–$110 area is where I want to see the market return. This zone was resistance before the break
Compare with SOL/USDT
SOL/USDT: Bearish MACD Divergence After Rally — Short SetupBias: Short (Bearish)
Timeframe: 15-Minute (15m)
Instrument: SOL/USDT (Binance)
Technical Analysis:
Bearish MACD Divergence: While SOL pushed higher into the $120.00 resistance zone forming a higher high, the MACD indicator marked clear lower highs. This loss of upside momentum suggests ex
SOLUSDT: Channel Lost, 100 USDT Back to FocusSOLUSDT is trading around 102.76 USDT after breaking below the ascending channel that had been in place since early September. The price is currently sitting below both the EMA34 and EMA89 (near 104.0), indicating that the short-term structure is increasingly bearish.
The 103.2–104.5 zone now serve
SOL/USDT — Professional Technical Analysis🚀 SOL/USDT — Professional Technical Analysis
📊 Timeframe: 2H
💰 Current Price: ~105.09 USDT
🟢 Market Structure
SOL is still trading inside a bullish ascending channel, maintaining higher highs and higher lows. Price is currently consolidating after rejection from 110.59 resistance.
🎯 Key Levels
🔴
SOLUSDT: Breakout Confirmed — Is 105 Next?SOL has pushed decisively above the resistance zone that capped price earlier. The breakout came with strong momentum, which tells me buyers are not simply testing the level—they are trying to take control of it.
After a move like this, a pullback into the broken zone would be healthy. The key is w
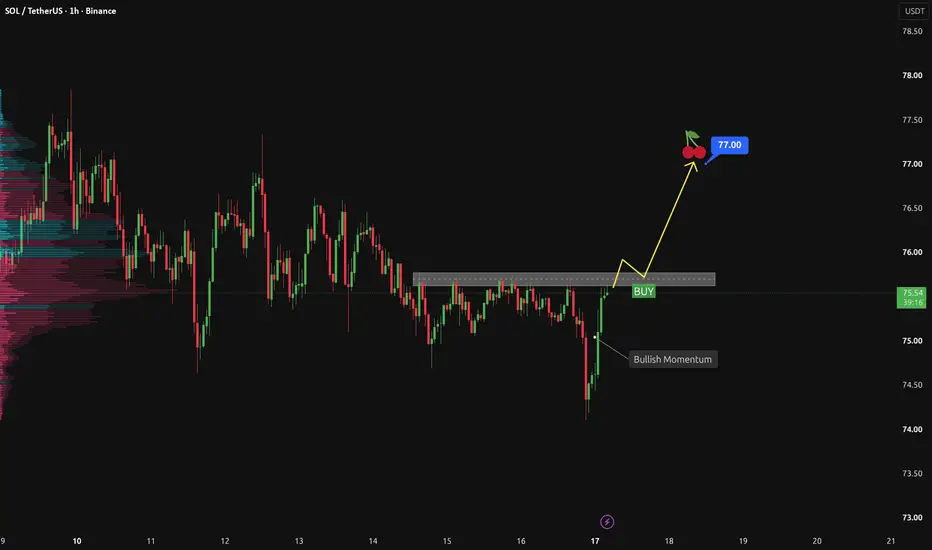
SOLUSDT Is Waiting for a Breakout. Could 77.00 Be Next?SOLUSDT is currently approaching the key resistance zone between 75.60 and 75.75, an area that has capped several previous recovery attempts. For me, this is not the time to rush into a long position. I want to see price break clearly above the zone, then return to retest and hold it as new support.
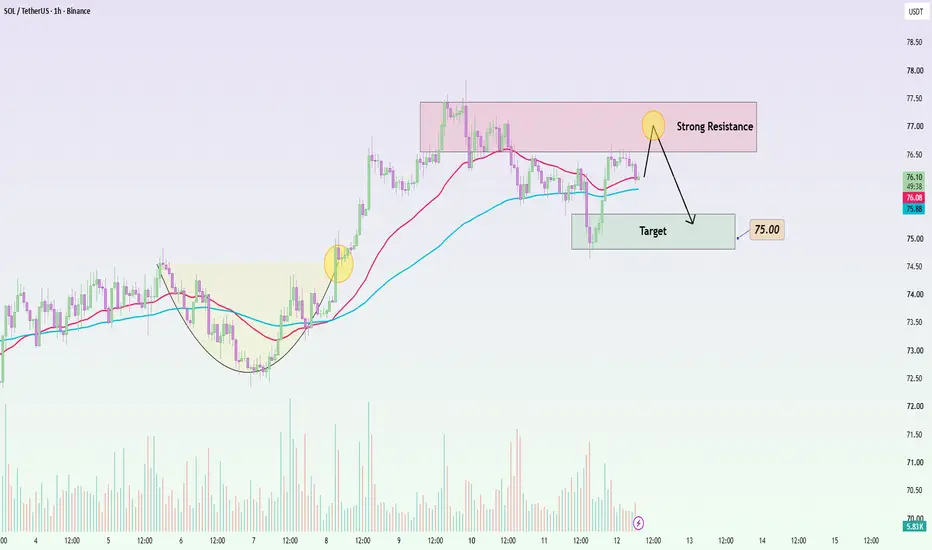
SOLUSDT: A Tough Hurdle for the BullsSOLUSDT is hovering around 76.0 USDT; despite a rebound from the 75 level, it has yet to break past the 76.6–77.4 USDT resistance zone.
Macro factors currently favor a correction scenario. The USD is edging up, Bitcoin remains under pressure near the 63.6K mark, and the crypto market is maintaining
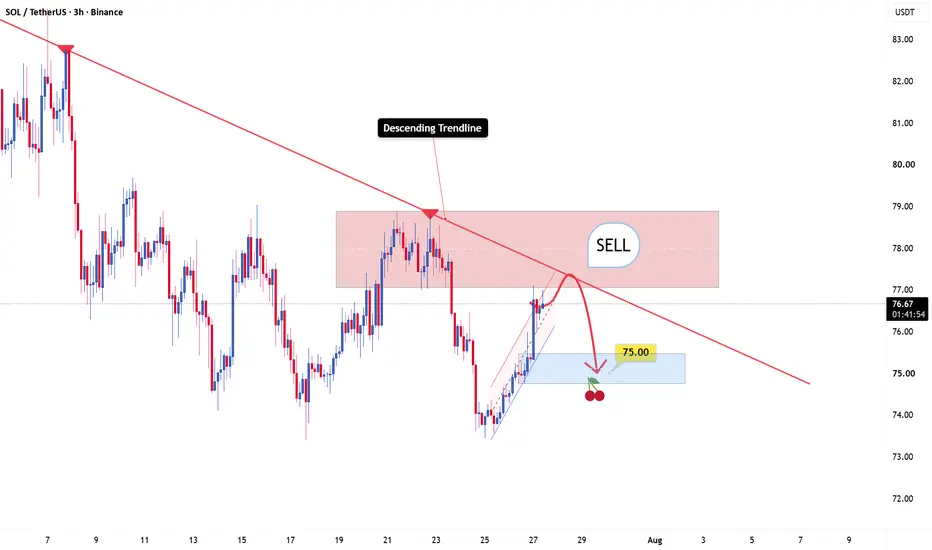
SOLUSDT: A Short-Term Pullback Could Be ComingSolana has shown strong recovery momentum recently, with buyers stepping in aggressively after the sharp decline.
However, I don’t think this upside move will continue without facing resistance. The current structure is starting to approach an important area where sellers have previously defended,
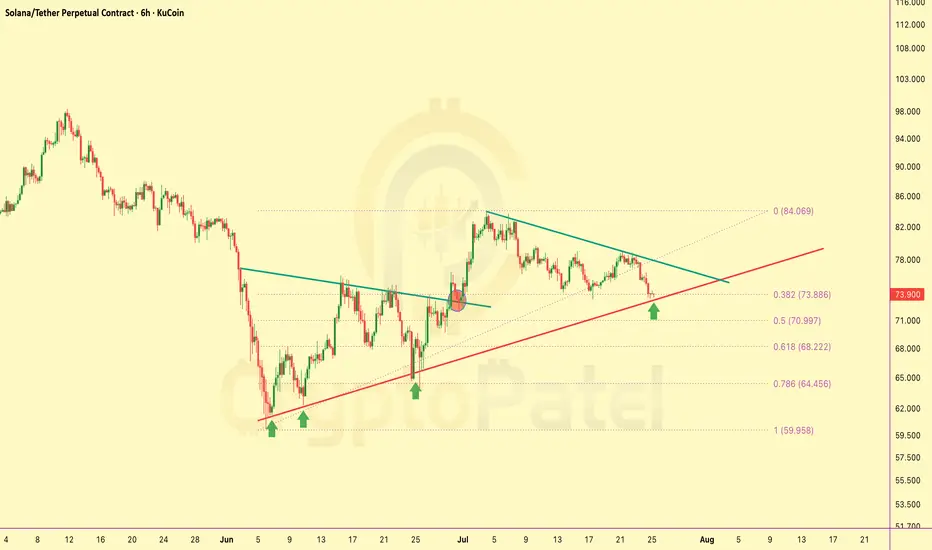
$SOL Is Sitting At The Most Important Level Of This CycleCRYPTOCAP:SOL Is Sitting At The Most Important Level Of This Cycle
#SOL is trading inside a high-confluence HTF demand zone where the previous breakout base, weekly support, and the 0.618 Fibonacci retracement all intersect.
This is the market's decision point.
▶️ Hold $73 → Bullish structure rem
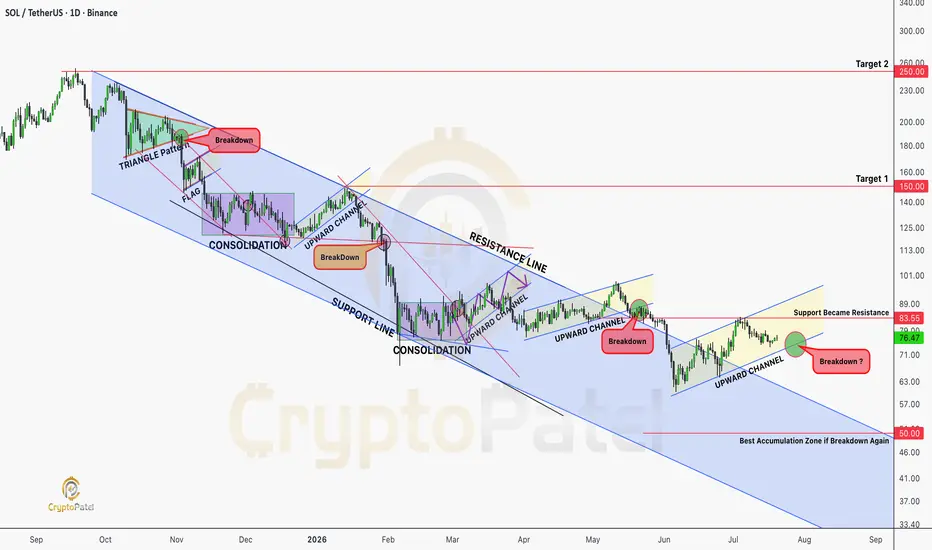
Will Solana Potential $1000 in Next Altseason?CRYPTOCAP:SOL Is Sitting At A Critical HTF Decision Point.
Lose This Rising Channel And A Move Toward The $70–$50 Accumulation Zone Becomes Increasingly Likely. Bulls Must Defend.
Long Term, I'm Highly Confident CRYPTOCAP:SOL Can Reach $500, Then $1,000. That's Why $70–$50 Looks Like A High-Conv
See all ideas
Summarizing what the indicators are suggesting.
Oscillators
Neutral
Oscillators
Neutral
Summary
Neutral
Summary
Neutral
Summary
Neutral
Moving Averages
Neutral
Moving Averages
Neutral
Displays a symbol's price movements over previous years to identify recurring trends.
Frequently asked questions
The current price of Solana/USDT (SOL) is 105.46 USDT — it has risen 1.94% in the past 24 hours. Try placing this info into the context by checking out what coins are also gaining and losing at the moment and seeing SOL price chart.
Solana/USDT price has fallen by −8.62% over the last week, its month performance shows a 3.63% increase, and as for the last year, Solana/USDT has decreased by −45.60%. See more dynamics on SOL price chart.
Keep track of coins' changes with our Crypto Coins Heatmap.
Solana/USDT (SOL) reached its highest price on Jan 19, 2025 — it amounted to 295.90 USDT. Find more insights on the SOL price chart.
See the list of crypto gainers and choose what best fits your strategy.
Solana/USDT (SOL) reached the lowest price of 0.31 USDT on Oct 28, 2020. View more Solana/USDT dynamics on the price chart.
See the list of crypto losers to find unexpected opportunities.
The safest choice when buying SOL is to go to a well-known crypto exchange. Some of the popular names are Binance, Coinbase, Kraken. But you'll have to find a reliable broker and create an account first. You can trade SOL right from TradingView charts — just choose a broker and connect to your account.
Crypto markets are famous for their volatility, so one should study all the available stats before adding crypto assets to their portfolio. Very often it's technical analysis that comes in handy. We prepared technical ratings for Solana/USDT (SOL): today its technical analysis shows the neutral signal, and according to the 1 week rating SOL shows the neutral signal. And you'd better dig deeper and study 1 month rating too — it's sell. Find inspiration in Solana/USDT trading ideas and keep track of what's moving crypto markets with our crypto news feed.
Solana/USDT (SOL) is just as reliable as any other crypto asset — this corner of the world market is highly volatile. Today, for instance, Solana/USDT is estimated as 0.73% volatile. The only thing it means is that you must prepare and examine all available information before making a decision.
You can discuss Solana/USDT (SOL) with other users in our public chats, Minds or in the comments to Ideas.