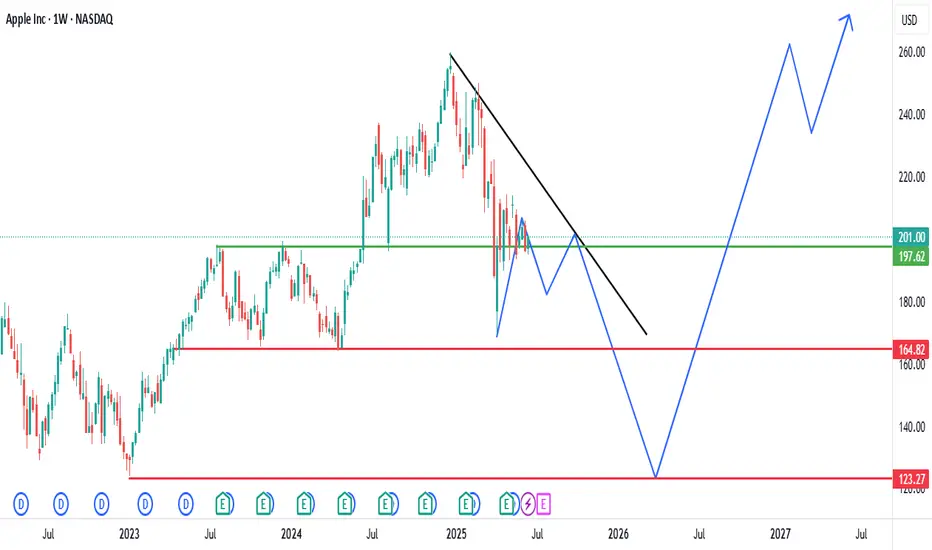
#APPLE breakout soon #APPLE breakout soon for 388 level in long term
after breakout open to new life time high as charts and pattern shows
Apple Inc.
No trades
Next report date
—
Report period
—
EPS estimate
—
Revenue estimate
—
6.40 EUR
95.45 B EUR
354.65 B EUR
14.76 B
About Apple Inc
Sector
Industry
CEO
Timothy Donald Cook
Website
Headquarters
Cupertino
Founded
1976
Identifiers
3
ISINUS0378331005
Apple, Inc. engages in the design, manufacture, and sale of smartphones, personal computers, tablets, wearables and accessories, and other varieties of related services. It operates through the following geographical segments: Americas, Europe, Greater China, Japan, and Rest of Asia Pacific. The Americas segment includes North and South America. The Europe segment consists of European countries, as well as India, the Middle East, and Africa. The Greater China segment comprises China, Hong Kong, and Taiwan. The Rest of Asia Pacific segment includes Australia and Asian countries. Its products and services include iPhone, Mac, iPad, AirPods, Apple TV, Apple Watch, Beats products, AppleCare, iCloud, digital content stores, streaming, and licensing services. The company was founded by Steven Paul Jobs, Ronald Gerald Wayne, and Stephen G. Wozniak in April 1976 and is headquartered in Cupertino, CA.
Related stocks
APPLE is about to turn bearish Apple could turn bearish because macro and company factors are aligning negatively.
US debt: Soaring national debt means higher interest rates and weaker consumer demand, which can drag down all high valuation stocks like Apple.
Apple Intelligence flop: Its AI rollout has stumbled delays, underwhe

long trade on appleweekly structure is bullish and we are expecting the price to rise from the support levels
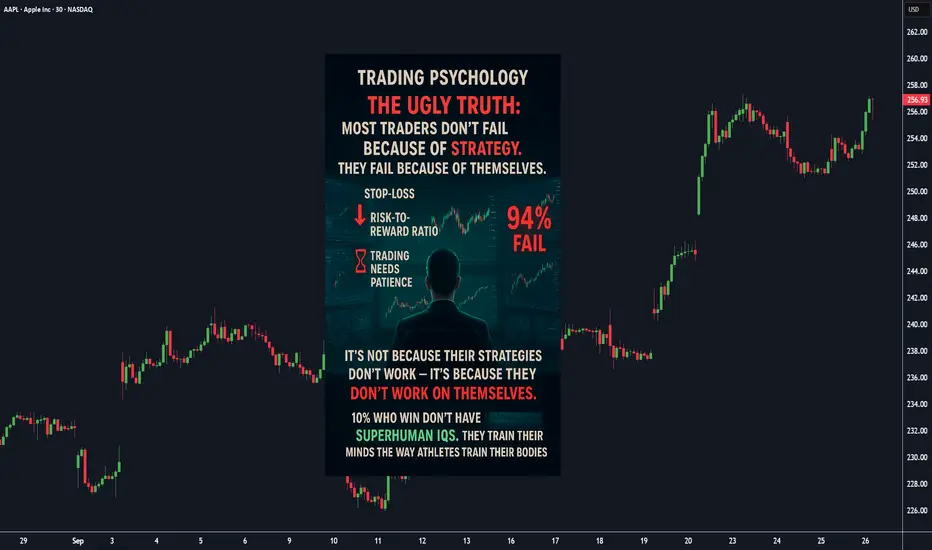
Psychology, Why 90% of Traders Fail (And How to Be the 10%)⚡ The ugly truth: Most traders don’t fail because of strategy. They fail because of *themselves* . It’s NOT bad strategies, it’s bad psychology.
📉 Here’s the real story 👇:
We know about stop-losses.
We know about risk-to-reward.
We know patience matters.
Imagine this: You’ve plan
Bullish Signs from AMZN Options Chain Sept 29, 2025Bullish Signs from AMZN Options Chain
The AMZN options chain for the September 26, 2025 expiry shows strong buy-side activity, with significant open interest in near-term call options around key strike prices such as 230, 235, and 240. Notably, the open interest stands at 30,319, 27,281, and 25,454
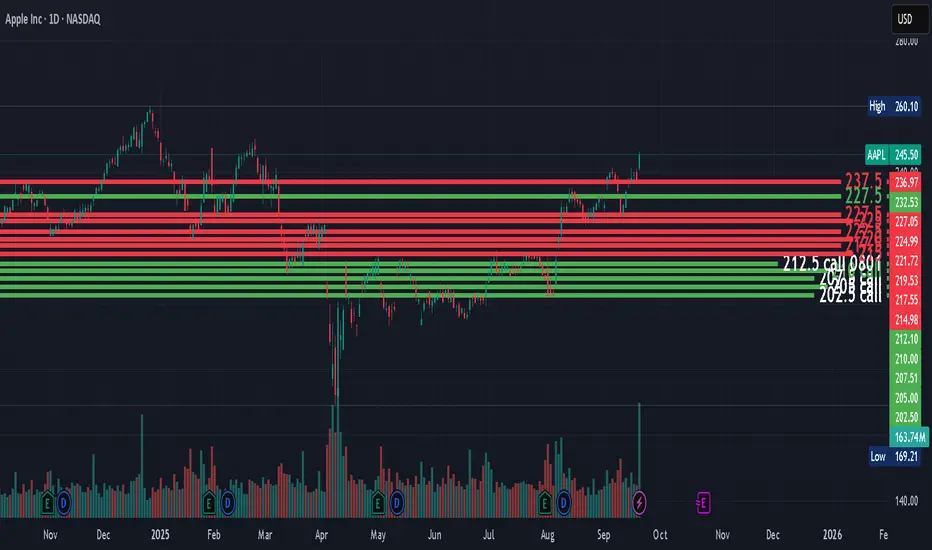
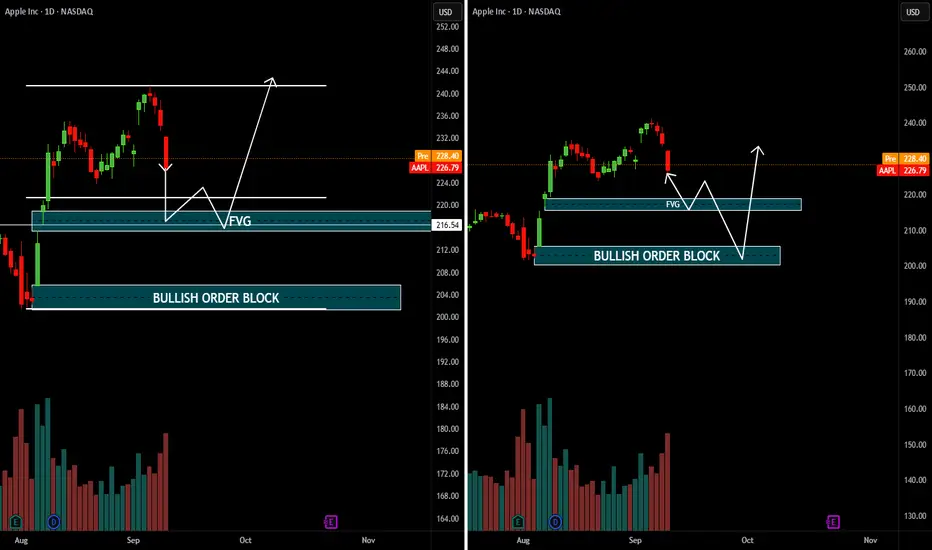
APPLETechnical Outlook
Immediate Support:
216 (FVG zone) → first reaction level.
200–204 (Bullish OB) → stronger demand zone if deeper correction happens.
Resistance / Targets:
Near-term resistance at 232–236 (recent high).
Breakout above this could open path to 248–252.
Bias:
Still bullish as lo
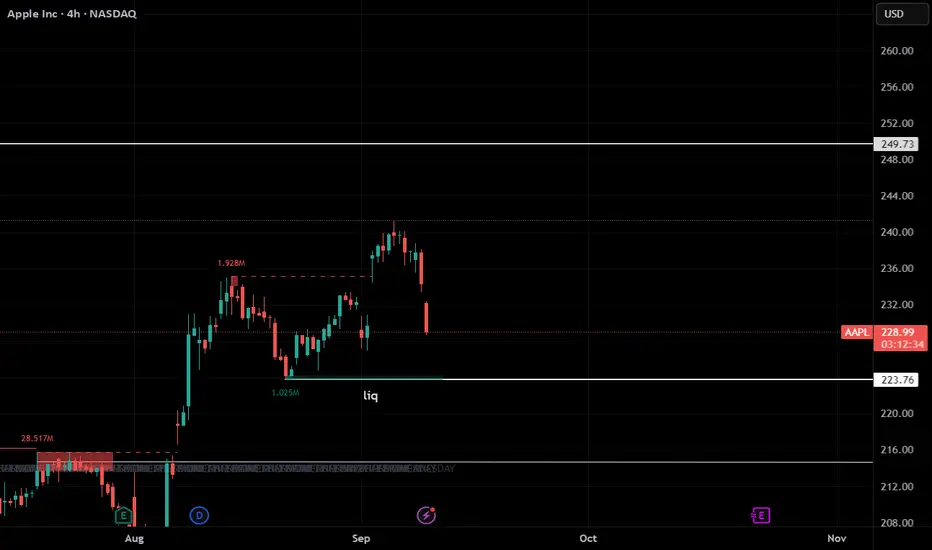
AAPL STOCKS BEARISH wait for liquidity hunt and take long entry in apple stocks
liq hunt price = 223 $
TARGET =249 $
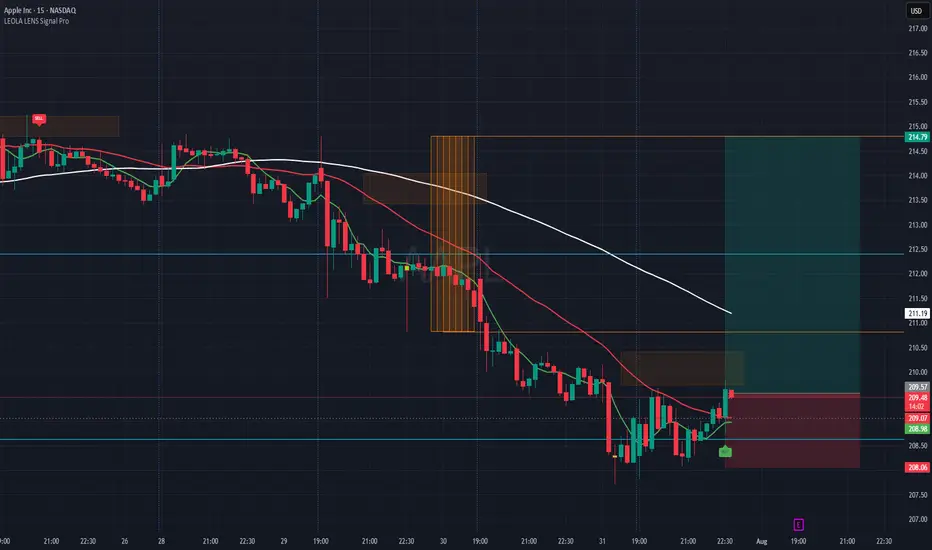
AAPL-Reaction Setup Lower Structure Zone-Eyes LongThis chart captures a structure-aware buy setup on Apple Inc. (AAPL), using Leola Lens SignalPro with momentum overlays and risk visualization.
What the Chart Shows:
🟢 A new BUY label appeared after price tapped a previously marked liquidity zone.
📉 Prior bearish momentum exhausted near 208.50–20
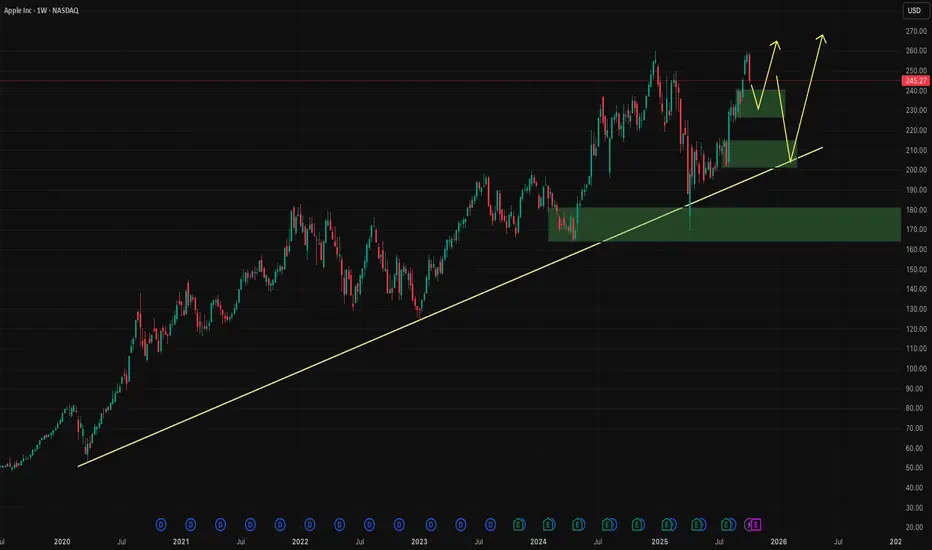
Aapl📈 NASDAQ:AAPL Weekly Chart Update
Apple is forming its third bullish flag since Jan 2023.
🔹 Flags:
1️⃣ Jan 2023 – Feb 2024
2️⃣ May 2024 – Mar 2025
3️⃣ Ongoing since Apr 2025
🔺 A triangle formation from Dec 2024 to Apr 2025 low is also converging.
💥 Breakout level: Weekly close above $216
📉 Stop L
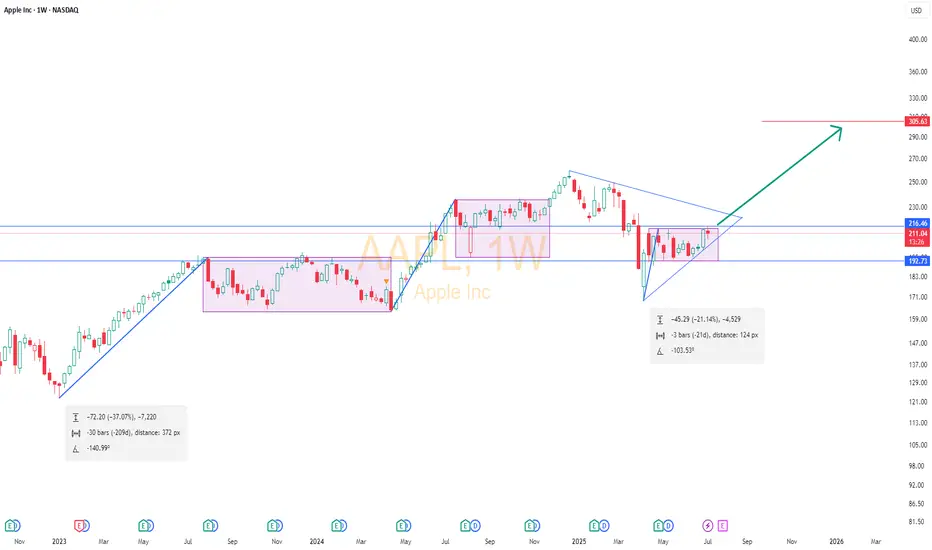
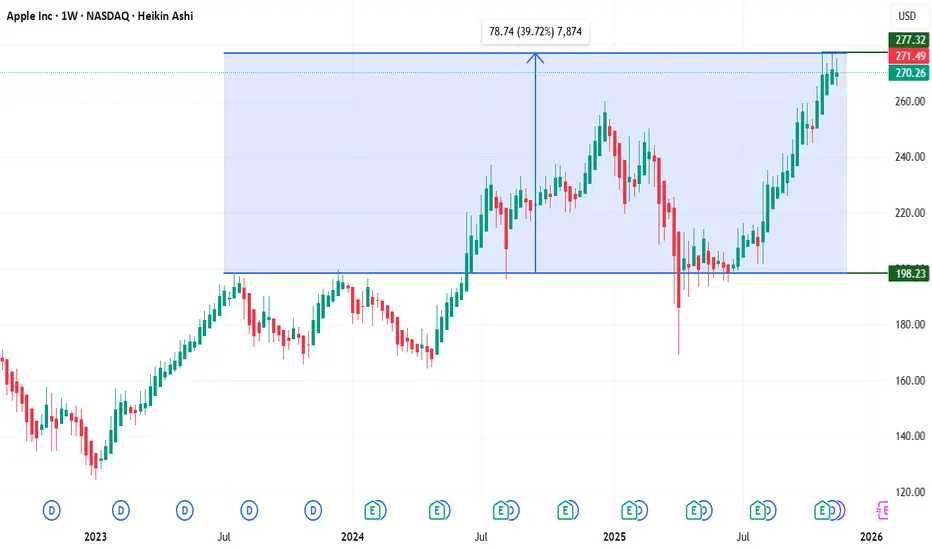
Analysis of Apple Inc. (AAPL) Weekly ChartHistorical Trend: The chart shows Apple Inc.'s stock price on a weekly timeframe from 2022 to mid-2025. The stock exhibited a strong upward trend from 2022 to early 2025, with notable growth followed by periods of consolidation and correction.
Key Levels:
Resistance: The $201.00-$197.62 range (gre
See all ideas
Summarizing what the indicators are suggesting.
Neutral
SellBuy
Strong sellStrong buy
Strong sellSellNeutralBuyStrong buy
Neutral
SellBuy
Strong sellStrong buy
Strong sellSellNeutralBuyStrong buy
Neutral
SellBuy
Strong sellStrong buy
Strong sellSellNeutralBuyStrong buy
An aggregate view of professional's ratings.
Neutral
SellBuy
Strong sellStrong buy
Strong sellSellNeutralBuyStrong buy
Neutral
SellBuy
Strong sellStrong buy
Strong sellSellNeutralBuyStrong buy
Neutral
SellBuy
Strong sellStrong buy
Strong sellSellNeutralBuyStrong buy
Displays a symbol's price movements over previous years to identify recurring trends.
US37833ER7
Apple Inc. 4.1% 08-AUG-2062Yield to maturity
5.47%
Maturity date
Aug 8, 2062
US37833EL0
Apple Inc. 2.85% 05-AUG-2061Yield to maturity
5.46%
Maturity date
Aug 5, 2061
US37833EG1
Apple Inc. 2.8% 08-FEB-2061Yield to maturity
5.46%
Maturity date
Feb 8, 2061
US37833DQ0
Apple Inc. 2.95% 11-SEP-2049Yield to maturity
5.45%
Maturity date
Sep 11, 2049
US37833DW7
Apple Inc. 2.65% 11-MAY-2050Yield to maturity
5.45%
Maturity date
May 11, 2050
US37833EF3
Apple Inc. 2.65% 08-FEB-2051Yield to maturity
5.44%
Maturity date
Feb 8, 2051
US37833EK2
Apple Inc. 2.7% 05-AUG-2051Yield to maturity
5.43%
Maturity date
Aug 5, 2051
US37833DD9
Apple Inc. 3.75% 12-SEP-2047Yield to maturity
5.42%
Maturity date
Sep 12, 2047
US37833EQ9
Apple Inc. 3.95% 08-AUG-2052Yield to maturity
5.41%
Maturity date
Aug 8, 2052
US37833CD0
Apple Inc. 3.85% 04-AUG-2046Yield to maturity
5.39%
Maturity date
Aug 4, 2046
US37833DZ0
Apple Inc. 2.4% 20-AUG-2050Yield to maturity
5.39%
Maturity date
Aug 20, 2050
See all APC bonds
Curated watchlists where APC is featured.


Frequently Asked Questions
The current price of APC is 230.90 EUR — it has increased by 0.17% in the past 24 hours. Watch Apple Inc. stock price performance more closely on the chart.
Depending on the exchange, the stock ticker may vary. For instance, on SWB exchange Apple Inc. stocks are traded under the ticker APC.
APC stock has fallen by −1.61% compared to the previous week, the month change is a 1.31% rise, over the last year Apple Inc. has showed a −3.02% decrease.
We've gathered analysts' opinions on Apple Inc. future price: according to them, APC price has a max estimate of 298.12 EUR and a min estimate of 183.13 EUR. Watch APC chart and read a more detailed Apple Inc. stock forecast: see what analysts think of Apple Inc. and suggest that you do with its stocks.
APC stock is 0.78% volatile and has beta coefficient of 1.22. Track Apple Inc. stock price on the chart and check out the list of the most volatile stocks — is Apple Inc. there?
Today Apple Inc. has the market capitalization of 3.43 T, it has decreased by −2.26% over the last week.
Yes, you can track Apple Inc. financials in yearly and quarterly reports right on TradingView.
Apple Inc. is going to release the next earnings report on Jan 29, 2026. Keep track of upcoming events with our Earnings Calendar.
APC earnings for the last quarter are 1.58 EUR per share, whereas the estimation was 1.51 EUR resulting in a 4.10% surprise. The estimated earnings for the next quarter are 2.27 EUR per share. See more details about Apple Inc. earnings.
Apple Inc. revenue for the last quarter amounts to 87.32 B EUR, despite the estimated figure of 87.12 B EUR. In the next quarter, revenue is expected to reach 117.23 B EUR.
APC net income for the last quarter is 23.41 B EUR, while the quarter before that showed 19.89 B EUR of net income which accounts for 17.66% change. Track more Apple Inc. financial stats to get the full picture.
Yes, APC dividends are paid quarterly. The last dividend per share was 0.22 EUR. As of today, Dividend Yield (TTM)% is 0.38%. Tracking Apple Inc. dividends might help you take more informed decisions.
Apple Inc. dividend yield was 0.40% in 2025, and payout ratio reached 13.66%. The year before the numbers were 0.43% and 16.11% correspondingly. See high-dividend stocks and find more opportunities for your portfolio.
As of Dec 19, 2025, the company has 166 K employees. See our rating of the largest employees — is Apple Inc. on this list?
EBITDA measures a company's operating performance, its growth signifies an improvement in the efficiency of a company. Apple Inc. EBITDA is 123.35 B EUR, and current EBITDA margin is 34.78%. See more stats in Apple Inc. financial statements.
Like other stocks, APC shares are traded on stock exchanges, e.g. Nasdaq, Nyse, Euronext, and the easiest way to buy them is through an online stock broker. To do this, you need to open an account and follow a broker's procedures, then start trading. You can trade Apple Inc. stock right from TradingView charts — choose your broker and connect to your account.
Investing in stocks requires a comprehensive research: you should carefully study all the available data, e.g. company's financials, related news, and its technical analysis. So Apple Inc. technincal analysis shows the neutral today, and its 1 week rating is buy. Since market conditions are prone to changes, it's worth looking a bit further into the future — according to the 1 month rating Apple Inc. stock shows the buy signal. See more of Apple Inc. technicals for a more comprehensive analysis.
If you're still not sure, try looking for inspiration in our curated watchlists.
If you're still not sure, try looking for inspiration in our curated watchlists.