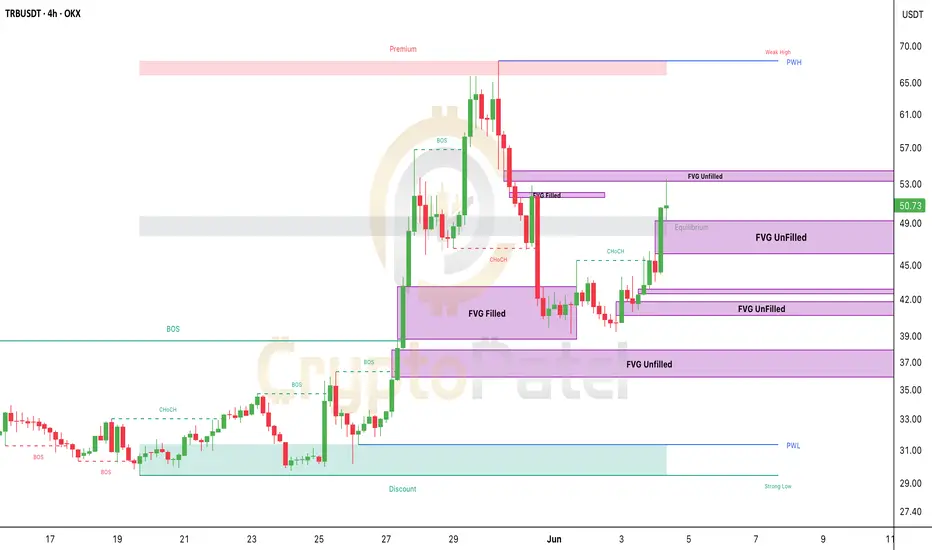
TRBUSDT SMC Chart Analysis – 4H Timeframe🚨 TRBUSDT SMC Chart Analysis – 4H Timeframe 🚨
What’s Happening?
TRB is moving in a well-defined bullish structure — with multiple Breaks of Structure (BOS) and a confirmed Change of Character (CHoCH) from the lows.
Smart Money appears to be in control — hunting liquidity and filling key imbalances
Related pairs
TRB Bull Launchpad Preparations in work...TRB is looking very bullish on charts. If TRB break this bearish zone wedgeline it can skyrocket to 80 dollar target with a mega pump.

TRBUSDT: Bullish Breakout or Retail Trap?Yello Paradisers! TRBUSDT is showing signs of a potential bullish move, backed by its strong bullish market structure and a supportive trendline. However, this setup could soon become a classic trap for retail traders if the market induces premature entries.
💎If TRBUSDT takes inducement and shows a

Will TRBUSDT Trigger a Massive Bullish Rally?Yello, Paradisers! 🌞 Is TRBUSDT about to explode, or will it fizzle out? Let’s dive in!
💎TRBUSDT has broken out of its descending channel and formed a W pattern, which typically signals a strong probability for a bullish move ahead.
💎But here's the key—if TRBUSDT breaks above the resistance zone a

TRBUSDT.PTRBUSDT.P
EM: 53.51/52.37
HIGH RISK!
TP: $64+
Sl: 50.02
Entry type:
Limit & confirmation entry!

TRBUSDT: Will This Bullish Breakout Lead to Massive Gains?Yello traders! Are you ready to seize this potentially lucrative opportunity? TRBUSDT has broken through a resistive trendline, showing Internal Change of Character (I-CHoCH) towards a bullish market structure. This significantly increases the probability of a bullish move.
💎 Currently, the price i

TRB: Watch for Key Breaks to Validate Bullish Trend!💎 Paradisers, #TRBUSDT has broken out of a falling wedge pattern and has now formed a 'W' pattern, which increases the likelihood of a bullish move.
💎 If #TRB closes a candle above the resistance level, it will validate the pattern, and we can set our targets at the previous swings.
💎 However, if


trb/usdtthis is not a financial advice.trb has tapped bearish order block now heading for a down move

TRB under Bearish Pennant Pattern#TRB 1hr. Chart Analysis
After Bullish Growth and Manupulation by Whalers in TRB Since 25th to 28th Sept. from $25 to $67, just 2.5x in just 3-days, it's HYIP is finished yet and moving towards downtrend again as a Correction chart into Bearish #Pennant Pattern.
It's Very big chances to break-out

See all ideas
Summarizing what the indicators are suggesting.
Oscillators
Neutral
SellBuy
Strong sellStrong buy
Strong sellSellNeutralBuyStrong buy
Oscillators
Neutral
SellBuy
Strong sellStrong buy
Strong sellSellNeutralBuyStrong buy
Summary
Neutral
SellBuy
Strong sellStrong buy
Strong sellSellNeutralBuyStrong buy
Summary
Neutral
SellBuy
Strong sellStrong buy
Strong sellSellNeutralBuyStrong buy
Summary
Neutral
SellBuy
Strong sellStrong buy
Strong sellSellNeutralBuyStrong buy
Moving Averages
Neutral
SellBuy
Strong sellStrong buy
Strong sellSellNeutralBuyStrong buy
Moving Averages
Neutral
SellBuy
Strong sellStrong buy
Strong sellSellNeutralBuyStrong buy
Frequently Asked Questions
The current price of TRB3xLong/Tether (TRB) is 0.07784 USDT — it has risen 15.52% in the past 24 hours. Try placing this info into the context by checking out what coins are also gaining and losing at the moment and seeing TRB price chart.
TRB3xLong/Tether price has fallen by −48.10% over the last week, its month performance shows a −30.90% decrease, and as for the last year, TRB3xLong/Tether has decreased by −92.08%. See more dynamics on TRB price chart.
Keep track of coins' changes with our Crypto Coins Heatmap.
Keep track of coins' changes with our Crypto Coins Heatmap.
TRB3xLong/Tether (TRB) reached its highest price on May 30, 2025 — it amounted to 2.12046 USDT. Find more insights on the TRB price chart.
See the list of crypto gainers and choose what best fits your strategy.
See the list of crypto gainers and choose what best fits your strategy.
TRB3xLong/Tether (TRB) reached the lowest price of 0.09262 USDT on Aug 25, 2025. View more TRB3xLong/Tether dynamics on the price chart.
See the list of crypto losers to find unexpected opportunities.
See the list of crypto losers to find unexpected opportunities.
The safest choice when buying TRB is to go to a well-known crypto exchange. Some of the popular names are Binance, Coinbase, Kraken. But you'll have to find a reliable broker and create an account first. You can trade TRB right from TradingView charts — just choose a broker and connect to your account.
TRB3xLong/Tether (TRB) is just as reliable as any other crypto asset — this corner of the world market is highly volatile. Today, for instance, TRB3xLong/Tether is estimated as 6.41% volatile. The only thing it means is that you must prepare and examine all available information before making a decision. And if you're not sure about TRB3xLong/Tether, you can find more inspiration in our curated watchlists.
You can discuss TRB3xLong/Tether (TRB) with other users in our public chats, Minds or in the comments to Ideas.