Will TRON hit $2 in this bull run?If CRYPTOCAP:TRX loses $0.26 I'm deleting this tweet. If it holds? We're going to $2 💎
Currently: $0.26 ✅
Target: $2.00 🔜
Upside: 600%
Bulls in full control and NOT losing this level 💪
Screenshot this tweet
NFA & DYOR
Related pairs

$TRX is forming a classic Head & Shoulders pattern on the 1-hourCRYPTOCAP:TRX is forming a classic Head & Shoulders pattern on the 1-hour timeframe — a structure often hinting at a trend reversal from bullish to bearish momentum.
🔹Left Shoulder: Formed near 0.3005, showing the first local top.
🔸Head: Peaked around 0.3030, marking the highest point of the curr

TRON $TRX WILL BOUNCE BACK HARDCRYPTOCAP:TRX 💰4H Analysis
Right now, the price is testing a buy zone around $0.2926–$0.2982. If there’s a quick bounce from this area, it could be a good spot to open long positions 🐬. The main idea is to catch the reversal and target a move back up to the highlighted POI zone.
🚀Long targets: $0

$TRX on the 30mins chart has formed a Inverse Head & Shoulders AMEX:TRX on the 30mins chart has formed a clear Inverse Head & Shoulders pattern ✅
🔹 Left Shoulder – 0.338
🔹 Head – 0.333
🔹 Right Shoulder – 0.337
🔹 Breakout neckline – around 0.341
✅ If price sustains above the neckline (0.341), momentum could push #TRX toward 0.345 → 0.351 → 0.360 in short-term

Will TRON hit $1 Club?TRON rise has been nothing short of epic.
From $0.0068 at launch to $0.36 today, over 50x growth.
$1 isn’t a dream anymore… it’s getting closer every day.
Who’s ready for CRYPTOCAP:TRX to crash into the $1 club? 🚀
NFA & DYOR

TRX Long Swing Setup – Waiting for Pullback After Bullish RallyTRX has seen a strong rally over the past few days, and we’re now watching for a retracement into support. The $0.260–$0.262 zone offers a potential long spot entry as price cools off.
📌 Trade Setup:
• Entry Zone: $0.260 – $0.262
• Take Profit Targets:
o 🥇 $0.278
o 🥈 $0.292
• Stop Loss: Daily clo

TRX NEXT EXPLOSION INCOMING? TRX NEXT EXPLOSION INCOMING?
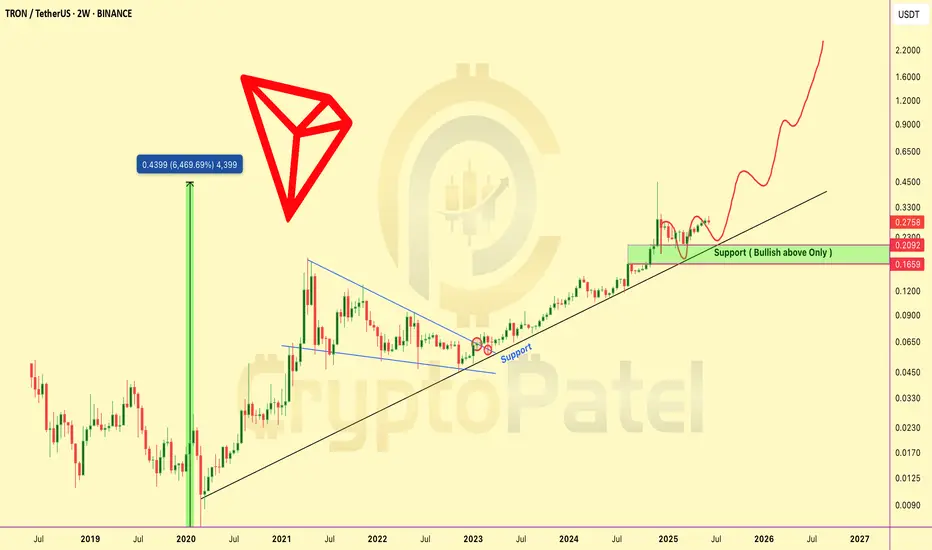
TRX is showing a strong bullish setup after breaking out of a long-term consolidation pattern.
🔹 Price has cleanly broken out of a multi-year descending structure
🔹 Retested the key support zone around $0.21–$0.23
🔹 Still respecting the long-term ascending trendline fro
#TRON to $1? Highly Possible! But Gold Entry is Key #TRON to $1? Highly Possible! But Gold Entry is Key 🚀
📉 Best Accumulation Zone for CRYPTOCAP:TRX : $0.140 - $0.10
🏆 Patience & Strategy Win the Game!
NFA. DYOR!
CRYPTOCAP:TRX #Altcoins

$TRX hit our 200% target as predicted! 🚀 CRYPTOCAP:TRX hit our 200% target as predicted!
Tron is showing strong momentum, and I still believe $1 is possible this bull run!
📉 Best buy zone: $0.180 - $0.160 (if we get it).
Who’s holding TRX to $1?
RT & Like if you’re bullish! 🔄

Trx offering good opportunity to grab.Tron chart showing clear breakdown in 4hr candle and have a 10% upside potential.

See all ideas
Summarizing what the indicators are suggesting.
Oscillators
Neutral
SellBuy
Strong sellStrong buy
Strong sellSellNeutralBuyStrong buy
Oscillators
Neutral
SellBuy
Strong sellStrong buy
Strong sellSellNeutralBuyStrong buy
Summary
Neutral
SellBuy
Strong sellStrong buy
Strong sellSellNeutralBuyStrong buy
Summary
Neutral
SellBuy
Strong sellStrong buy
Strong sellSellNeutralBuyStrong buy
Summary
Neutral
SellBuy
Strong sellStrong buy
Strong sellSellNeutralBuyStrong buy
Moving Averages
Neutral
SellBuy
Strong sellStrong buy
Strong sellSellNeutralBuyStrong buy
Moving Averages
Neutral
SellBuy
Strong sellStrong buy
Strong sellSellNeutralBuyStrong buy
Displays a symbol's price movements over previous years to identify recurring trends.
Frequently Asked Questions
The current price of TRON / TetherUS (TRX) is 0.2826 USDT — it has fallen −0.53% in the past 24 hours. Try placing this info into the context by checking out what coins are also gaining and losing at the moment and seeing TRX price chart.
TRON / TetherUS price has risen by 1.69% over the last week, its month performance shows a 3.17% increase, and as for the last year, TRON / TetherUS has increased by 11.88%. See more dynamics on TRX price chart.
Keep track of coins' changes with our Crypto Coins Heatmap.
Keep track of coins' changes with our Crypto Coins Heatmap.
TRON / TetherUS (TRX) reached its highest price on Dec 4, 2024 — it amounted to 0.4500 USDT. Find more insights on the TRX price chart.
See the list of crypto gainers and choose what best fits your strategy.
See the list of crypto gainers and choose what best fits your strategy.
TRON / TetherUS (TRX) reached the lowest price of 0.0068 USDT on Mar 13, 2020. View more TRON / TetherUS dynamics on the price chart.
See the list of crypto losers to find unexpected opportunities.
See the list of crypto losers to find unexpected opportunities.
The safest choice when buying TRX is to go to a well-known crypto exchange. Some of the popular names are Binance, Coinbase, Kraken. But you'll have to find a reliable broker and create an account first. You can trade TRX right from TradingView charts — just choose a broker and connect to your account.
Crypto markets are famous for their volatility, so one should study all the available stats before adding crypto assets to their portfolio. Very often it's technical analysis that comes in handy. We prepared technical ratings for TRON / TetherUS (TRX): today its technical analysis shows the sell signal, and according to the 1 week rating TRX shows the neutral signal. And you'd better dig deeper and study 1 month rating too — it's buy. Find inspiration in TRON / TetherUS trading ideas and keep track of what's moving crypto markets with our crypto news feed.
TRON / TetherUS (TRX) is just as reliable as any other crypto asset — this corner of the world market is highly volatile. Today, for instance, TRON / TetherUS is estimated as 0.92% volatile. The only thing it means is that you must prepare and examine all available information before making a decision. And if you're not sure about TRON / TetherUS, you can find more inspiration in our curated watchlists.
You can discuss TRON / TetherUS (TRX) with other users in our public chats, Minds or in the comments to Ideas.