Quantitative Trading in India1. What is Quantitative Trading?
Quantitative trading involves developing mathematical models that analyze large sets of historical and real-time market data to identify profitable trading opportunities. These models are then translated into algorithms that execute trades automatically when specific conditions are met.
Unlike traditional trading, where decisions are based on human analysis or intuition, quant trading depends on data-driven models—built from statistical patterns, price behavior, and probability-based predictions.
For instance, a quantitative model might identify that whenever a particular stock’s price crosses its 50-day moving average, there’s a 60% chance it will rise by 1% in the next two days. The algorithm will then automatically place a buy order when this condition occurs and exit when profit or risk targets are hit.
2. The Rise of Quantitative Trading in India
The Indian financial market has undergone a digital revolution in the past decade. The introduction of advanced trading platforms, co-location services by exchanges, and faster internet connectivity has made algorithmic and quantitative trading more accessible.
NSE and BSE Initiatives: Both the National Stock Exchange (NSE) and Bombay Stock Exchange (BSE) allow algorithmic trading through their APIs. The NSE launched “NOW” and later “Colo” services that let institutional traders place their servers near the exchange for low-latency execution.
Growth in HFT and Algo Desks: Many domestic and foreign institutional investors now operate high-frequency trading (HFT) and quant desks in India.
Retail Access: With brokers like Zerodha, Upstox, and Interactive Brokers offering APIs, even retail traders can deploy basic quant strategies today.
India’s equity and derivatives markets—known for their liquidity and volatility—offer ideal conditions for quantitative models to thrive.
3. Key Components of Quantitative Trading
Quantitative trading relies on multiple technical and analytical components:
a. Data Collection and Processing
The foundation of quant trading is data—price, volume, volatility, order book, and macroeconomic indicators. Traders use both historical data (to backtest strategies) and real-time data (for live execution).
Data is cleaned, normalized, and structured before being fed into analytical models.
b. Mathematical Modeling
Traders use statistical and machine learning techniques to find relationships in the data. Common techniques include:
Regression analysis to predict future price moves.
Time-series modeling like ARIMA or GARCH for volatility forecasting.
Machine learning models such as random forests or neural networks to identify non-linear market patterns.
c. Backtesting
Before deploying a model, it’s tested on historical data to evaluate performance metrics—profitability, drawdown, win rate, and Sharpe ratio. This step helps refine parameters and assess risk.
d. Execution Systems
The strategy is implemented using automated scripts written in Python, C++, or R. Execution systems ensure the trade is carried out efficiently and at the desired price, with minimal slippage and latency.
e. Risk Management
Quantitative traders use strict risk management protocols, including stop-losses, position sizing, and portfolio diversification. Models also include safeguards to handle sudden market disruptions.
4. Types of Quantitative Trading Strategies
Quant trading covers a wide range of strategies. Some of the most popular in India include:
a. Statistical Arbitrage
This strategy involves exploiting temporary price inefficiencies between correlated securities. For example, if two bank stocks usually move together but diverge briefly, a trader might short one and buy the other, expecting prices to converge.
b. Mean Reversion
Based on the idea that prices eventually revert to their mean, traders buy when prices fall below the average and sell when they rise above it.
c. Momentum Trading
Momentum models look for stocks showing strong price movements in one direction and attempt to ride the trend. These are popular in the Indian equity derivatives market.
d. Market Making
Market makers provide liquidity by simultaneously placing buy and sell orders, earning from the bid-ask spread. Quant systems are used to constantly adjust quotes based on volatility and order flow.
e. Machine Learning-Based Models
AI and deep learning models analyze large datasets—including news, social media sentiment, and macro data—to predict short-term price trends.
5. Technology and Infrastructure
Quantitative trading demands high computing power and low-latency infrastructure.
Key tools and technologies include:
Programming Languages: Python, R, C++, and MATLAB for model development.
Databases: SQL, MongoDB, and time-series databases to handle massive data.
Cloud Computing: Platforms like AWS and Google Cloud for scalability.
APIs and FIX Protocols: For real-time data and automated order execution.
Co-location Servers: Provided by NSE and BSE for high-speed trading.
6. Regulatory Framework in India
The Securities and Exchange Board of India (SEBI) regulates quantitative and algorithmic trading. Some of the major regulations include:
Approval Requirement: Institutional participants must get exchange approval before using an algorithm.
Risk Checks: Pre-trade risk controls are mandatory—such as order price bands and quantity limits.
Audit Trail: All automated strategies must maintain complete logs of trades.
Fair Access: SEBI ensures equal market access for all participants, preventing latency advantages.
Retail traders using broker APIs are also subject to compliance checks, including throttling limits and order validations.
7. Advantages of Quantitative Trading
Quant trading offers multiple advantages over traditional manual methods:
Emotion-Free Decision Making: Models rely on logic and data, not human emotion.
Speed and Efficiency: Algorithms execute trades in microseconds.
Backtesting Capability: Strategies can be tested before deployment.
Scalability: The same model can be applied across multiple instruments.
Diversification: Automated systems can manage hundreds of securities simultaneously.
8. Challenges in India’s Quant Landscape
Despite its growth, quant trading in India faces unique challenges:
Data Quality: Historical tick data is expensive and often inconsistent.
Regulatory Complexity: Frequent SEBI changes create compliance hurdles.
Infrastructure Costs: Co-location and low-latency systems are costly for small firms.
Talent Gap: Skilled professionals with expertise in both finance and coding are limited.
Market Depth: While Nifty and Bank Nifty are highly liquid, smaller stocks lack sufficient volume for quant models.
9. The Future of Quantitative Trading in India
The future of quantitative trading in India looks extremely promising. As AI, machine learning, and big data analytics continue to evolve, trading models are becoming smarter and faster. The democratization of APIs and data feeds is enabling more retail traders to experiment with quant strategies.
Additionally, with the growth of quant funds, hedge funds, and proprietary trading firms in India, institutional adoption is accelerating. Educational programs and fintech incubators are also nurturing the next generation of quantitative analysts.
In the coming years, India is likely to see:
Greater integration of AI-driven predictive analytics.
Expansion of retail quant platforms.
Development of multi-asset quant models including commodities and currencies.
Stronger regulatory frameworks ensuring market fairness.
10. Conclusion
Quantitative trading is transforming India’s financial landscape. It represents the intersection of finance, mathematics, and technology—allowing traders to make data-driven decisions with precision and speed. While challenges like regulation and data access remain, the momentum toward automation is irreversible.
As markets mature and technology becomes more accessible, quantitative trading will continue to dominate institutional desks and increasingly empower sophisticated retail participants. In essence, the future of trading in India is quantitative, algorithmic, and intelligent.
Trade ideas
Commodity Trading: Gold, Silver, Crude Oil, Natural Gas on MCX1. Overview of MCX and Commodity Trading
The Multi Commodity Exchange (MCX) was established in 2003 and operates under the regulatory framework of the Securities and Exchange Board of India (SEBI). It provides a transparent and standardized platform for trading in commodity derivatives, allowing market participants to hedge against price volatility or take speculative positions based on their market outlook.
Commodity trading on MCX includes bullion (gold, silver), energy (crude oil, natural gas), and base metals (copper, zinc, aluminum) among others. Prices are largely influenced by international benchmarks — for example, COMEX for gold and silver, and NYMEX for crude oil and natural gas — since commodities are globally traded and denominated in U.S. dollars.
2. Gold Trading on MCX
a. Importance of Gold
Gold is considered both a precious metal and a safe-haven asset. It acts as a hedge against inflation, currency depreciation, and economic uncertainty. In India, gold also holds immense cultural and investment value, making it one of the most traded commodities.
b. MCX Gold Contracts
MCX offers multiple gold contracts to cater to different categories of traders:
Gold (1 kg)
Gold Mini (100 grams)
Gold Guinea (8 grams)
Gold Petal (1 gram)
Gold Petal (New Delhi)
Each contract differs in lot size and margin requirements, allowing both retail and institutional traders to participate. The price quote is in Rupees per 10 grams, and the underlying is standard gold of 995 purity.
c. Factors Influencing Gold Prices
Global economic data (especially U.S. inflation, employment, and GDP)
US Dollar movement – Gold has an inverse relationship with the USD.
Interest rate changes by the U.S. Federal Reserve.
Geopolitical tensions or crises that boost safe-haven demand.
Jewelry demand and central bank reserves.
d. Trading Strategy
Gold trading often combines technical analysis (using trendlines, moving averages, and RSI) with macro fundamentals (like Fed announcements). Traders also track the COMEX gold price and the rupee-dollar exchange rate for near-term movement cues on MCX.
3. Silver Trading on MCX
a. Role of Silver
Silver, often referred to as the “poor man’s gold,” has both precious and industrial uses. It’s widely used in electronics, solar panels, and medical instruments. This dual nature makes silver more volatile than gold.
b. MCX Silver Contracts
MCX offers several contracts:
Silver (30 kg)
Silver Mini (5 kg)
Silver Micro (1 kg)
Silver 1000 (30 kg, 999 purity)
The price quote is in Rupees per kilogram. Silver contracts are physically settled, ensuring price integrity and alignment with physical market demand.
c. Price Influencers
Industrial demand in electronics and solar sectors.
Gold price movement (since silver tends to follow gold trends).
US Dollar and bond yields.
Global supply-demand balances from major producers like Mexico and Peru.
d. Trading Insights
Silver’s high volatility appeals to short-term traders. It responds strongly to global macro news and industrial growth data. Many traders use gold-silver ratio analysis — when the ratio widens, it may suggest silver is undervalued relative to gold, and vice versa.
4. Crude Oil Trading on MCX
a. Significance of Crude Oil
Crude oil is the lifeblood of the global economy — influencing transport, manufacturing, and inflation. As one of the most liquid commodities, it offers dynamic trading opportunities. MCX crude oil prices track NYMEX WTI Crude, adjusted for the INR/USD rate.
b. MCX Crude Oil Contracts
MCX offers:
Crude Oil (100 barrels)
Crude Oil Mini (10 barrels)
Prices are quoted in Rupees per barrel. Contract expiries are aligned with global oil futures.
c. Key Factors Affecting Prices
Global demand-supply balance led by OPEC decisions.
U.S. crude inventory data from the Energy Information Administration (EIA).
Geopolitical tensions in the Middle East.
Dollar strength and global growth outlook.
Production levels in the U.S. shale industry.
d. Trading Strategies
Crude oil traders closely track weekly U.S. inventory reports, OPEC meetings, and economic indicators like global PMI data. Technical tools like Bollinger Bands and MACD help spot momentum reversals. Traders also hedge exposure against energy price swings using MCX crude futures.
5. Natural Gas Trading on MCX
a. Overview
Natural gas is a crucial energy source used for power generation, heating, and industrial processes. With the rise in clean energy demand, gas trading volumes have been rising sharply on MCX.
b. Contract Specifications
MCX offers Natural Gas (1250 mmBtu) contracts, quoted in Rupees per mmBtu (million British thermal units). Prices track NYMEX Natural Gas futures, with adjustments for INR movements.
c. Price Influences
Weather conditions – cold winters or hot summers drive higher consumption.
Inventory levels in U.S. gas storage.
Production trends from shale fields.
Transition toward clean energy and LNG demand.
Global geopolitical events affecting gas supply routes.
d. Trading Approach
Natural gas prices are highly seasonal and volatile. Traders use weather forecasts, EIA inventory data, and technical tools like support-resistance zones to time entries. Given its volatility, proper risk management and position sizing are essential.
6. Trading Mechanism and Settlement
All commodities on MCX are traded electronically, ensuring transparency. Contracts are margined, meaning traders need only deposit a fraction of the total value (typically 5–10%) as margin.
Settlement can be of two types:
Cash settlement, based on final settlement price.
Physical delivery, for bullion and select metals.
Traders should be aware of expiry dates, daily price limits, and margin requirements to manage positions effectively.
7. Risk Management and Hedging
Commodity derivatives are vital tools for hedgers (like jewelers or oil companies) to protect against adverse price movements. For instance:
A jeweler may short gold futures to hedge inventory.
An airline may buy crude oil futures to fix fuel costs.
Speculators and arbitrageurs add liquidity, but they must apply strict stop losses, technical discipline, and volatility tracking to avoid large losses.
8. Conclusion
Commodity trading on the MCX — particularly in Gold, Silver, Crude Oil, and Natural Gas — offers immense opportunities for profit and portfolio diversification. These commodities are deeply connected to global macroeconomic events, geopolitical developments, and currency movements.
Success in this market requires a blend of technical analysis, fundamental understanding, and emotional discipline. For retail traders, starting with mini or micro contracts and focusing on risk control is key. As India’s participation in the global commodity market expands, MCX remains a vital gateway for investors to tap into the pulse of international trade and energy trends.

Technical Indicators 1. Introduction to Technical Indicators
Technical indicators are mathematical calculations based on historical price, volume, or open interest data. They are primarily used in technical analysis, a method of evaluating securities by analyzing market statistics rather than intrinsic value.
Indicators help traders:
Identify trends and reversals.
Determine momentum and market strength.
Recognize overbought or oversold conditions.
Generate buy or sell signals.
There are three main categories of technical indicators:
Trend Indicators – Identify the direction and strength of a trend.
Momentum Indicators – Measure the speed and force of price movements.
Volume Indicators – Analyze trading activity to confirm price movements.
Some indicators are leading, giving early signals of potential price movement, while others are lagging, confirming trends after they have started.
2. Trend Indicators
Trend indicators help traders identify whether an asset is moving upward, downward, or sideways. Recognizing trends early allows traders to align their strategies with the market direction.
2.1 Moving Averages (MA)
Moving averages smooth out price data to reveal trends over a specific period. There are two main types:
Simple Moving Average (SMA):
Calculated by averaging the closing prices over a specified period.
Example: A 50-day SMA sums the last 50 closing prices and divides by 50.
Exponential Moving Average (EMA):
Places more weight on recent prices, making it more responsive to price changes.
Applications:
Trend identification: Prices above the MA indicate an uptrend; below indicate a downtrend.
Crossovers: A short-term MA crossing above a long-term MA generates a bullish signal, and vice versa.
Limitations:
Lagging indicator, less effective in sideways markets.
2.2 Moving Average Convergence Divergence (MACD)
MACD measures the difference between two EMAs (usually 12-day and 26-day).
Components:
MACD Line: Difference between the fast and slow EMA.
Signal Line: 9-day EMA of the MACD line.
Histogram: Difference between MACD line and Signal line.
Interpretation:
Crossovers: MACD crossing above Signal line = buy signal; below = sell signal.
Divergence: Price making new highs while MACD fails indicates trend weakness.
Strengths:
Effective for spotting trend reversals and momentum shifts.
Weaknesses:
Lagging indicator; may give false signals in choppy markets.
2.3 Average Directional Index (ADX)
ADX measures the strength of a trend regardless of its direction.
Values above 25 indicate a strong trend.
Values below 20 suggest a weak trend or sideways market.
Applications:
Confirming trend strength before entering a trade.
Pairing with other indicators for trend-following strategies.
Limitations:
Does not indicate trend direction, only strength.
3. Momentum Indicators
Momentum indicators assess the speed of price movements, helping traders identify potential reversals or continuation patterns.
3.1 Relative Strength Index (RSI)
RSI measures the magnitude of recent price changes to evaluate overbought or oversold conditions.
Values above 70 = overbought (possible reversal or pullback).
Values below 30 = oversold (possible rebound).
Applications:
Divergence between RSI and price signals potential trend reversals.
Combining RSI with trend indicators enhances trade accuracy.
Limitations:
Can remain overbought or oversold for extended periods in strong trends.
3.2 Stochastic Oscillator
The stochastic oscillator compares a security’s closing price to its price range over a specific period.
%K Line: Current close relative to the high-low range.
%D Line: 3-period moving average of %K.
Interpretation:
Values above 80 = overbought; below 20 = oversold.
Crossovers of %K and %D lines indicate potential buy/sell signals.
Strengths:
Effective in volatile markets for timing entries and exits.
Weaknesses:
Less effective during strong trends; prone to false signals.
3.3 Rate of Change (ROC)
ROC measures the percentage change in price over a given period.
Positive ROC indicates upward momentum.
Negative ROC signals downward momentum.
Applications:
Identifying early trend reversals.
Confirming breakouts or breakdowns.
Limitations:
Sensitive to price spikes; may give false signals in choppy markets.
4. Volume Indicators
Volume analysis confirms price trends, as strong moves are typically accompanied by high volume.
4.1 On-Balance Volume (OBV)
OBV measures cumulative buying and selling pressure by adding volume on up days and subtracting volume on down days.
Applications:
Divergence between OBV and price can signal reversals.
Confirming trend strength.
Limitations:
Lagging indicator; requires combination with price analysis.
4.2 Chaikin Money Flow (CMF)
CMF measures the volume-weighted average of accumulation and distribution over a specified period.
Positive CMF = buying pressure.
Negative CMF = selling pressure.
Applications:
Identifying accumulation or distribution phases.
Supporting trade entries in trend-following strategies.
Weaknesses:
Less effective during low-volume periods.
5. Volatility Indicators
Volatility indicators help traders gauge market risk and potential price swings.
5.1 Bollinger Bands
Bollinger Bands consist of a moving average (middle band) and upper/lower bands based on standard deviation.
Price near upper band = overbought.
Price near lower band = oversold.
Applications:
Trading range-bound markets using band bounces.
Breakouts indicated when price moves outside bands.
Limitations:
Band breakouts don’t always result in sustained trends.
5.2 Average True Range (ATR)
ATR measures market volatility by calculating the average of true price ranges over a period.
Applications:
Setting stop-loss levels.
Identifying breakout potential.
Limitations:
Does not indicate trend direction, only volatility.
6. Combining Indicators for Strategy
Using a single indicator often results in false signals. Effective traders combine indicators from different categories:
Trend + Momentum:
Example: Use SMA to identify trend direction and RSI to detect overbought/oversold conditions.
Trend + Volume:
Example: Confirm trend strength with ADX and OBV before entering a trade.
Momentum + Volatility:
Example: Use MACD for momentum and ATR to set stop-loss levels.
Rule of Thumb:
Avoid indicators that provide the same information.
Mix leading and lagging indicators for better confirmation.
7. Indicator-Based Trading Strategies
7.1 Trend-Following Strategy
Use moving averages or ADX to identify trends.
Enter trades in the direction of the trend.
Use momentum indicators like MACD or RSI for entry timing.
7.2 Reversal Strategy
Use RSI, Stochastic, or Bollinger Bands to detect overbought/oversold conditions.
Look for divergence between price and indicator for potential reversals.
7.3 Breakout Strategy
Use Bollinger Bands or price channels to identify consolidation.
Volume indicators like OBV or CMF confirm breakout strength.
8. Common Mistakes in Using Indicators
Overloading charts: Too many indicators can confuse signals.
Ignoring market context: Indicators must be interpreted in conjunction with price action.
Blind reliance: No indicator guarantees success; risk management is crucial.
Neglecting timeframes: Indicators behave differently on daily, weekly, or intraday charts.
9. Advanced Indicator Techniques
Divergence Trading: Identifying differences between price and indicators like MACD or RSI to spot potential reversals.
Multiple Timeframe Analysis: Confirm signals from multiple timeframes to reduce false entries.
Weighted Indicators: Adjust indicator sensitivity to reduce lag or noise.
Algorithmic Integration: Using indicators as inputs in automated trading systems.
10. Choosing the Right Indicators
Factors to consider:
Trading style: Day traders vs. swing traders vs. long-term investors.
Market conditions: Trending vs. ranging markets.
Timeframe: Short-term indicators are more sensitive; long-term indicators reduce noise.
Simplicity: Choose a few reliable indicators rather than overwhelming charts.
11. Conclusion
Mastering technical indicators requires practice, observation, and discipline. While indicators provide valuable insights into market behavior, they are most effective when combined with strong risk management and a clear trading plan.
Successful traders:
Use indicators to enhance decision-making, not replace it.
Test strategies thoroughly before applying them in live markets.
Adapt indicator settings to suit different market conditions.
By understanding the nuances of trend, momentum, volume, and volatility indicators, traders can create robust strategies that increase probability and confidence in their trades. This Technical Indicators Masterclass equips traders with the knowledge to analyze markets effectively and navigate complex price movements with precision.
Retail Trading Profits: Success in the Modern Financial Market Understanding Retail Trading
Retail traders participate in financial markets primarily through brokerage accounts, online trading platforms, and mobile applications. Their decisions are often guided by technical analysis, market news, financial statements, and social trading trends. Unlike institutional traders, who have access to advanced analytical tools, high-frequency trading systems, and large capital, retail traders rely on individual research, risk management, and discipline to generate profits.
Retail trading profits are influenced by:
Market Knowledge: Understanding how markets operate, the forces driving price movements, and economic indicators.
Risk Management: Controlling losses through stop-loss orders, position sizing, and portfolio diversification.
Trading Strategy: Choosing approaches such as day trading, swing trading, trend following, or options trading.
Psychology: Maintaining emotional discipline to avoid impulsive decisions driven by fear or greed.
Key Sources of Retail Trading Profits
1. Stock Market Trading
Retail traders often focus on equity markets. Profits arise from buying undervalued stocks and selling them at higher prices or leveraging derivatives like options and futures. Retail traders can target dividends, capital gains, or a combination of both.
2. Derivatives and Options
Options and futures provide opportunities for magnified profits but also carry significant risks. Retail traders can profit from market movements without owning the underlying asset by employing strategies such as:
Call and Put Options: Speculating on price increases or decreases.
Spreads and Straddles: Hedging risk while capitalizing on volatility.
Leverage: Using borrowed capital to amplify returns, which can also amplify losses.
3. Forex Trading
Retail forex trading involves currency pairs. Traders earn profits from exchange rate fluctuations by leveraging global economic news, interest rate decisions, and geopolitical developments.
4. Cryptocurrency Trading
The rise of cryptocurrencies has created volatile markets with potential for high returns. Retail traders profit through short-term trading or long-term holdings, often using technical indicators to identify price patterns.
5. Commodity Trading
Gold, silver, oil, and agricultural commodities provide alternative avenues for retail trading profits. Commodity trading relies on understanding global supply-demand dynamics and macroeconomic trends.
Strategies for Achieving Retail Trading Profits
1. Technical Analysis
Retail traders extensively use charts, indicators, and historical price data to predict market movements. Common tools include:
Moving Averages
Relative Strength Index (RSI)
Bollinger Bands
Fibonacci Retracements
Technical analysis helps traders identify entry and exit points, momentum, and trend reversals.
2. Fundamental Analysis
This involves evaluating the intrinsic value of stocks or assets based on financial statements, earnings reports, economic indicators, and industry trends. Retail traders use fundamental analysis to make long-term investment decisions rather than short-term speculation.
3. Risk Management
Profitable retail traders focus on protecting capital. Effective strategies include:
Setting stop-loss and take-profit levels
Diversifying across asset classes
Avoiding over-leverage
Limiting exposure to single trades
4. Trading Psychology
The psychological aspect of trading is crucial for consistent profits. Retail traders must control emotions, maintain discipline, and avoid chasing losses. Successful traders develop routines, journaling practices, and mental frameworks to stay objective.
Challenges to Retail Trading Profits
Despite the opportunities, retail trading is fraught with challenges:
High Competition: Retail traders compete with institutional investors who have better tools, information, and capital.
Emotional Biases: Fear, greed, and overconfidence can lead to impulsive trades and losses.
Market Volatility: Unpredictable market swings can wipe out gains quickly.
Information Overload: Excessive news and social media chatter can create confusion and poor decision-making.
Overtrading: Frequent trades in search of profits often lead to higher costs and lower net returns.
Best Practices for Maximizing Retail Trading Profits
Develop a Trading Plan: Clearly define goals, risk tolerance, and strategies.
Continuous Learning: Stay updated with market trends, technical tools, and financial news.
Use Demo Accounts: Practice strategies without risking real capital.
Leverage Technology: Use algorithmic tools, trading apps, and analytics to enhance decision-making.
Focus on Discipline: Stick to your plan, control emotions, and maintain realistic profit expectations.
Regular Review: Analyze past trades to learn from mistakes and refine strategies.
Conclusion
Retail trading profits are achievable, but they require a combination of knowledge, strategy, discipline, and risk management. While the potential for financial gain is significant, the challenges are equally formidable. By understanding the markets, employing structured strategies, managing risks, and cultivating strong trading psychology, retail traders can navigate market complexities and improve the probability of long-term profitability.

Global Market Shifts1. Introduction
Global markets are dynamic ecosystems where capital, goods, services, and information flow across borders. Shifts in these markets represent changes in patterns of trade, investment, currency valuation, risk appetite, and economic influence among countries or regions. Understanding these shifts is crucial for investors, policymakers, and traders because they directly influence portfolio strategies, national economic stability, and global financial connectivity.
Global market shifts can be sudden, triggered by geopolitical events, technological breakthroughs, or crises, or they can be gradual, influenced by demographic trends, policy reforms, and shifts in global supply-demand balances. These shifts impact equities, bonds, commodities, foreign exchange, and digital assets, creating opportunities and risks in both short-term trading and long-term investment strategies.
2. Historical Perspective of Global Market Shifts
2.1 Pre-20th Century Shifts
The concept of global markets is not new. Historical shifts can be traced to:
The Age of Exploration (15th–17th century): European expansion opened global trade routes, creating early financial centers in Amsterdam and London.
Industrial Revolution (18th–19th century): Mass production and technological innovation shifted economic power to industrialized nations. Capital markets expanded to fund infrastructure and factories.
Colonial Trade: Commodities like sugar, cotton, and spices became globally traded, influencing global capital flows and wealth distribution.
2.2 Early 20th Century
Interwar Period: Post-WWI reconstruction caused capital flows from the US to Europe. The 1929 stock market crash highlighted the interconnectedness of global financial systems.
Post-WWII Era: Establishment of Bretton Woods institutions (IMF, World Bank) stabilized currencies and encouraged multilateral trade. The US dollar emerged as the global reserve currency, shifting financial power toward the United States.
2.3 Late 20th Century Shifts
Globalization and Trade Liberalization: The 1980s and 1990s saw a surge in cross-border investments, driven by deregulation, technology, and emerging markets (China, India).
Financial Crises: Events like the 1997 Asian Financial Crisis and 2008 Global Financial Crisis reshaped market confidence, risk management practices, and regulatory frameworks worldwide.
3. Drivers of Global Market Shifts
Global market shifts are driven by a combination of economic, technological, geopolitical, and behavioral factors. Understanding these drivers is crucial for predicting trends and managing risks.
3.1 Economic Drivers
Monetary Policy: Interest rate decisions by central banks (Fed, ECB, BoJ) influence capital flows and currency valuations, causing global shifts in investment and trade patterns.
Fiscal Policy: Government spending, taxation, and public debt impact domestic growth, influencing foreign investment.
Inflation & Deflation: High inflation reduces real returns on bonds and equities, causing shifts toward commodities or alternative assets.
Global Trade Dynamics: Trade agreements, tariffs, and sanctions alter supply chains and capital allocation across regions.
3.2 Technological Drivers
Digital Transformation: Automation, AI, blockchain, and fintech innovations reshape global trading, payments, and investment platforms.
High-Frequency Trading (HFT): Algorithmic trading exploits price discrepancies across global markets, accelerating the speed of capital shifts.
Data Availability: Real-time global economic data enables investors to react instantly, increasing volatility and market interconnectedness.
3.3 Geopolitical Drivers
Wars and Conflicts: Conflicts disrupt supply chains, commodity flows, and investor confidence.
Diplomacy and Sanctions: Trade restrictions or sanctions shift market focus toward alternative trading partners.
Political Stability: Stable governments attract foreign investment, while instability triggers capital flight.
3.4 Behavioral and Psychological Drivers
Investor Sentiment: Fear and greed cycles influence global capital allocation and risk appetite.
Herd Behavior: Collective reactions to news or trends can magnify market shifts, causing bubbles or crashes.
Speculation: Short-term speculative activity, especially in currencies and commodities, can exacerbate market swings.
4. Types of Global Market Shifts
4.1 Currency Shifts
Fluctuations in exchange rates impact global trade and investment. Examples include:
Dollar Strength/Weakness: The USD’s dominance affects emerging markets’ debt sustainability.
Currency Crises: Rapid devaluations in countries like Turkey or Argentina can trigger regional financial instability.
4.2 Equity Market Shifts
Sectoral Rotation: Global investment often rotates between sectors based on macroeconomic trends (e.g., tech vs. commodities).
Emerging Market Surges: Markets like China, India, or Brazil attract capital during periods of rapid growth.
Market Corrections: Large-scale corrections ripple through global markets, especially during crises.
4.3 Commodity Market Shifts
Oil & Gas: Geopolitical conflicts in the Middle East or supply disruptions cause global energy price shocks.
Metals & Agriculture: Changing demand from industrializing nations or climate events influence commodity markets.
Precious Metals: Gold and silver act as hedges during currency depreciation or inflation.
4.4 Bond Market Shifts
Interest Rate Changes: Global bond yields react to central bank policies.
Flight-to-Safety Movements: During crises, capital shifts from equities to sovereign bonds in stable economies.
4.5 Digital Asset Shifts
Cryptocurrencies and Central Bank Digital Currencies (CBDCs) introduce new dimensions in cross-border payments and speculative flows, often moving faster than traditional assets.
5. Mechanisms of Global Market Shifts
5.1 Capital Flows
Global capital shifts through foreign direct investment (FDI), portfolio investments, and cross-border loans. Key mechanisms include:
Equity Investment: Buying stocks in foreign markets.
Bond Purchases: Sovereign or corporate bonds attract global investors seeking yields.
Venture Capital & Private Equity: Funding emerging tech and startups drives long-term shifts.
5.2 Trade Shifts
Changes in import/export patterns directly impact currency strength, commodity prices, and equity markets.
Regional trade agreements (e.g., USMCA, RCEP) can reroute capital and investment priorities.
5.3 Technological Interconnectivity
Digital trading platforms, APIs, and HFT algorithms accelerate the speed and scale of global shifts.
Real-time news and analytics platforms make global markets reactive to small events.
5.4 Speculative Movements
Hedge funds and institutional traders use leverage to amplify global market shifts.
Speculative bubbles can cause temporary but impactful disruptions in asset prices.
6. Case Studies of Major Global Market Shifts
6.1 The 2008 Global Financial Crisis
Triggered by US subprime mortgage defaults.
Resulted in a global credit crunch, massive equity declines, and sovereign debt crises.
Shifted investment toward safer assets and caused long-term regulatory reforms.
6.2 COVID-19 Pandemic
Global lockdowns disrupted supply chains, commodity flows, and labor markets.
Accelerated technology adoption and digital finance.
Triggered massive central bank interventions, leading to low interest rates globally.
6.3 US-China Trade War (2018–2020)
Tariffs and sanctions caused supply chain rerouting and increased investment in alternative markets.
Global markets reacted with sectoral shifts, affecting technology, manufacturing, and agriculture.
6.4 Russia-Ukraine Conflict (2022–2025)
Energy and commodity markets experienced historic volatility.
Shifted global energy trade toward renewables and alternative suppliers.
Increased defense spending in Europe influenced equity and bond markets.
7. Implications for Stakeholders
7.1 Investors
Must diversify across regions, sectors, and asset classes.
Require active monitoring of macroeconomic indicators and geopolitical risks.
Can capitalize on emerging market growth or sectoral rotations.
7.2 Traders
High-frequency and algorithmic traders exploit short-term market inefficiencies.
Currency and commodity traders must track global capital flows and central bank policies.
News trading strategies become more critical in volatile environments.
7.3 Policymakers
Need to anticipate capital flight and currency volatility.
Must coordinate with international institutions to stabilize markets during crises.
Regulatory reforms can shape long-term market resilience and investor confidence.
7.4 Corporates
Supply chain disruptions necessitate alternative sourcing strategies.
Foreign exchange volatility affects revenue and profit margins.
Investment planning must account for global economic cycles and market shifts.
8. Emerging Trends Shaping Future Global Market Shifts
8.1 Rise of Emerging Markets
Countries like India, Vietnam, and Nigeria attract FDI due to growth potential.
Shifts capital from traditional power centers (US, EU) to these new hubs.
8.2 Digital Assets and Fintech
Cryptocurrencies, CBDCs, and blockchain-based platforms enable faster, cross-border capital movements.
Decentralized finance may reduce reliance on traditional banking channels.
8.3 Climate Change and ESG Investing
Green finance, carbon trading, and sustainability-linked investments are influencing global capital allocation.
Traditional energy sectors may see declining investments, while renewable energy surges.
8.4 Geopolitical Realignments
Regional conflicts, trade blocs, and shifting alliances (e.g., US–EU–Asia dynamics) will continue to drive market shifts.
Energy independence, defense spending, and technological self-sufficiency influence investment flows.
8.5 AI and Automation
Artificial intelligence accelerates market analysis, predictive modeling, and trading execution.
Could increase volatility but also enhance risk management.
9. Challenges in Navigating Global Market Shifts
Volatility: Rapid shifts can erode capital and destabilize portfolios.
Information Overload: Massive real-time data streams make it difficult to separate noise from meaningful signals.
Policy Uncertainty: Sudden changes in regulations, sanctions, or trade policies create unpredictability.
Technological Disruption: Markets must adapt to fintech innovations, automated trading, and digital currencies.
Climate & ESG Risks: Environmental crises and regulations may cause unexpected sectoral disruptions.
10. Conclusion
Global market shifts are a complex interplay of economic, geopolitical, technological, and behavioral forces. They can be incremental or sudden, affecting currencies, equities, commodities, bonds, and digital assets. Historical crises demonstrate the interconnected nature of markets, while emerging trends highlight the importance of technology, sustainability, and global cooperation.
For investors, traders, corporates, and policymakers, understanding these shifts is no longer optional—it is essential. Effective strategies require real-time information, diversified portfolios, risk management, and a forward-looking approach that anticipates structural changes in the global economy.
By studying past shifts and monitoring ongoing developments, market participants can navigate volatility, capitalize on opportunities, and mitigate risks in an increasingly interconnected financial world.

Part 1 Candle Stick Pattern1. Introduction to Options
Financial markets have always revolved around two broad purposes—hedging risk and creating opportunity. Among the tools available, options stand out because they combine flexibility, leverage, and adaptability in a way few instruments can match. Unlike simply buying a stock or bond, an option lets you control exposure to price movements without outright ownership. This makes options both fascinating and complex.
Option trading today has exploded globally, with millions of retail and institutional traders participating daily. But to appreciate their role, we need to peel back the layers—what exactly is an option, how does it work, and why do traders and investors use them?
2. What Are Options? (Call & Put Basics)
An option is a financial derivative—meaning its value is derived from an underlying asset like a stock, index, commodity, or currency.
There are two main types:
Call Option – Gives the holder the right (not obligation) to buy the underlying at a set price (strike) before or on expiration.
Put Option – Gives the holder the right (not obligation) to sell the underlying at a set price before or on expiration.
Example: Suppose Reliance stock trades at ₹2,500. If you buy a call option with a strike price of ₹2,600 expiring in one month, you’re betting the stock will rise above ₹2,600. Conversely, if you buy a put option with a strike price of ₹2,400, you’re betting the stock will fall below ₹2,400.
The beauty lies in asymmetry: you can lose only the premium you pay, but your potential profit can be much larger.
3. Key Terminologies in Option Trading
Options trading comes with its own dictionary. Some must-know terms include:
Strike Price – Predetermined price to buy/sell underlying.
Expiration Date – Last date the option is valid.
Premium – Price paid to buy the option.
In the Money (ITM) – Option has intrinsic value (profitable if exercised immediately).
Out of the Money (OTM) – Option has no intrinsic value, only time value.
At the Money (ATM) – Strike price equals current market price.
Lot Size – Standardized quantity of underlying in each option contract.
Open Interest (OI) – Number of outstanding option contracts in the market.
Understanding these is critical before trading.
4. How Options Work in Practice
Let’s say you buy an Infosys call option with strike ₹1,500, paying ₹30 premium.
If Infosys rises to ₹1,600, your option has intrinsic value of ₹100. Profit = ₹100 – ₹30 = ₹70 per share.
If Infosys stays below ₹1,500, the option expires worthless. Loss = Premium (₹30).
Notice how a small move in stock can create a large percentage return on option, thanks to leverage.
5. Intrinsic Value vs. Time Value
Option price = Intrinsic Value + Time Value.
Intrinsic Value – Actual in-the-money amount.
Time Value – Extra premium traders pay for the possibility of future favorable movement before expiry.
Time value decreases with theta decay as expiration approaches.
6. Factors Influencing Option Pricing (The Greeks)
Options are sensitive to multiple variables. Traders rely on the Greeks to measure this sensitivity:
Delta – Rate of change in option price per unit move in underlying.
Gamma – Rate of change of delta.
Theta – Time decay; how much value option loses daily.
Vega – Sensitivity to volatility.
Rho – Impact of interest rates.
Mastering Greeks is like learning the steering controls of a car—you can’t drive well without them.
7. Types of Option Contracts
Options extend beyond equities:
Equity Options – On individual company stocks.
Index Options – On indices like Nifty, Bank Nifty, S&P 500.
Commodity Options – On crude oil, gold, natural gas.
Currency Options – On USD/INR, EUR/USD, etc.
Each market has unique dynamics, liquidity, and risks.
8. Options Market Structure
Options can be traded in two ways:
Exchange-Traded Options – Standardized, regulated, and liquid.
OTC (Over-the-Counter) Options – Customized contracts between institutions, used for hedging large exposures.
Retail traders mostly deal with exchange-traded options.

PCR Trading Strategies1. The Psychology of Option Trading
Options magnify emotions: greed (unlimited gains) and fear (time decay, sudden loss). Many traders lose due to overleveraging, chasing cheap OTM options, or not respecting stop-loss. Psychological discipline is as vital as technical knowledge.
2. Option Chain Analysis
An option chain shows all available strikes, premiums, OI (open interest), IV, etc. Traders analyze max pain, OI build-up, and put-call ratio (PCR) to gauge market sentiment. Option chains are powerful tools for directional and volatility analysis.
3. Role of Market Makers in Options
Market makers provide liquidity by quoting bid-ask spreads. They profit from spreads and hedging but ensure smoother trading. Without them, option spreads would widen, making it harder for retail traders to enter/exit efficiently.
4. Index Options vs Stock Options
Index Options (e.g., Nifty, Bank Nifty): Cash-settled, high liquidity, lower manipulation risk.
Stock Options: Physical settlement (delivery), less liquid, but higher potential returns.
Retail traders prefer index options; institutions often hedge with stock options.
5. Option Writing as a Business
Many professional traders treat option writing like a business: selling high IV options, hedging risk, managing spreads. Profits come steadily from time decay, but big moves can wipe out capital if risk isn’t managed with stop-loss or hedges.
6. Options and Event Trading
Events like earnings, RBI policy, budget, elections, or global news drastically affect IV. Traders buy straddles/strangles pre-event, and sellers wait for IV crush post-event. Understanding event volatility cycles is key.
7. Taxation of Options Trading in India
Profits from option trading are treated as business income under Indian tax law. Traders must maintain proper records, pay GST in some cases, and file ITR with audit if turnover exceeds limits. This is often ignored by beginners.
8. Technology and Algo in Options
With algo trading, institutions dominate options using complex models (volatility arbitrage, delta-hedging). Retail traders now use option analytics platforms, scanners, and automation tools to compete. Speed and data-driven execution matter more today.
9. Common Mistakes in Option Trading
Buying cheap OTM lottery tickets.
Ignoring IV crush.
Selling naked options without hedge.
Overtrading on expiry days.
Neglecting stop-loss and money management.
Most retail losses come from these errors.
10. The Future of Option Trading
Option trading is growing rapidly in India with weekly expiries, retail participation, and technology. Innovations like zero-day options (0DTE) in the US may come to India. Education, discipline, and structured strategies will define success. The future promises wider accessibility but higher competition as retail meets institutional algos

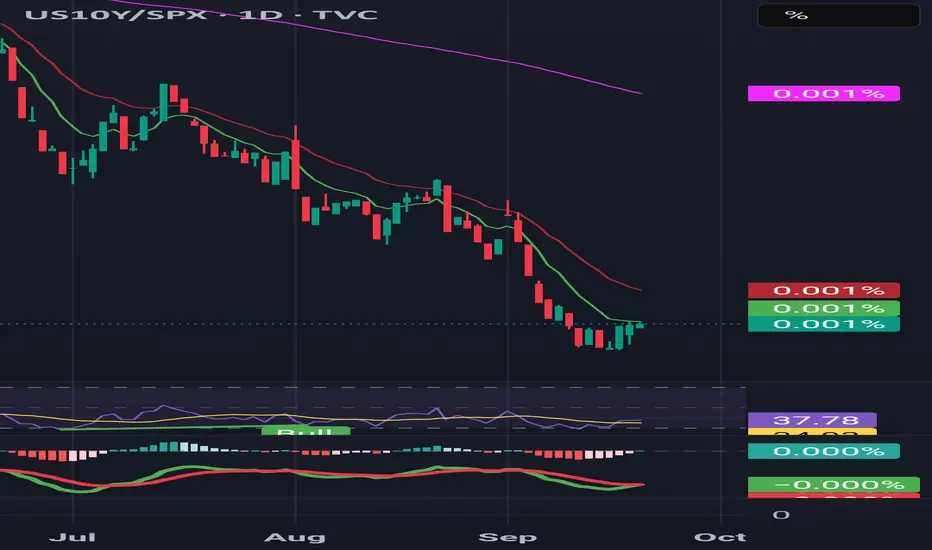
US10Y/SPX RATIO ANALYSIS The US10Y/SPX ratio has been crushed lower but is now trying to form a bottom. RSI is curling up from oversold, and MACD shows a potential bullish turn.
📌 Early signs that bonds may start regaining relative strength versus equities.
Part 3 Institutional Trading Role of Options in Hedging
Options are commonly used to hedge portfolios against adverse market movements:
Protective Put for Stocks: Investors holding equities can buy puts to protect against downside risks.
Portfolio Insurance: Institutions use options to safeguard large portfolios against market crashes.
Income Generation: Covered call writing allows long-term holders to earn additional income while maintaining exposure.
Hedging with options is especially popular in volatile markets where risk management is critical.
Pricing Models and Market Mechanics
Professional traders often rely on option pricing models, like the Black-Scholes model, to determine fair premiums. These models factor in:
Current price of the underlying asset
Strike price
Time to expiration
Volatility
Risk-free interest rate
Options markets operate through exchanges with standardized contracts. Market makers provide liquidity, and the bid-ask spread reflects supply-demand dynamics. In OTC markets, options can be customized to suit specific investor requirements.
Advantages of Options Trading
Leverage: Control a larger position for smaller capital.
Flexibility: Strategies for bullish, bearish, or neutral markets.
Hedging: Effective risk management tool.
Profit in Any Market: Can profit in rising, falling, or sideways markets with the right strategy.
Defined Risk (for Buyers): Limited to premium paid.
Challenges and Considerations
Complexity: Options require understanding of multiple factors affecting pricing.
Time Sensitivity: Options lose value as expiration nears.
Volatility Risk: Price swings can be unpredictable.
Liquidity Issues: Not all options have sufficient trading volume.
Psychological Pressure: Rapid movements and leverage can lead to emotional decisions.

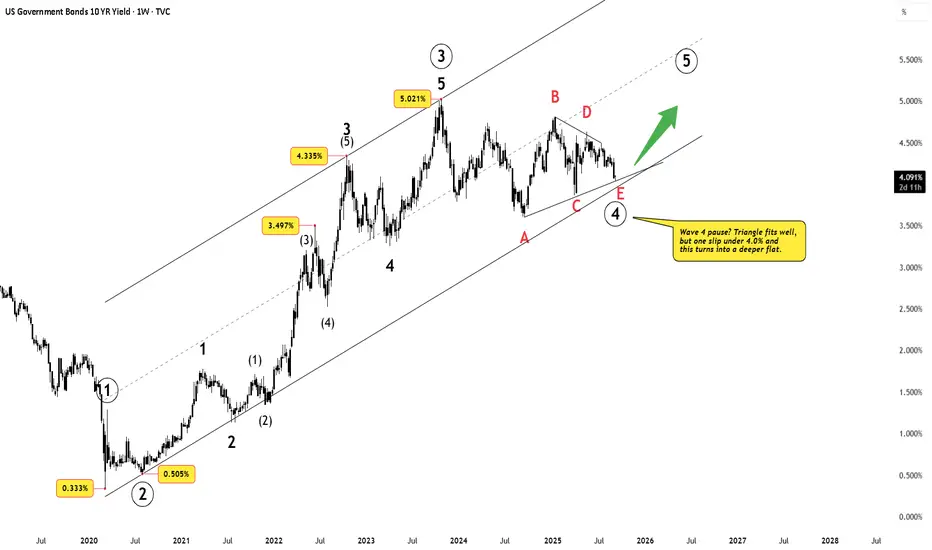
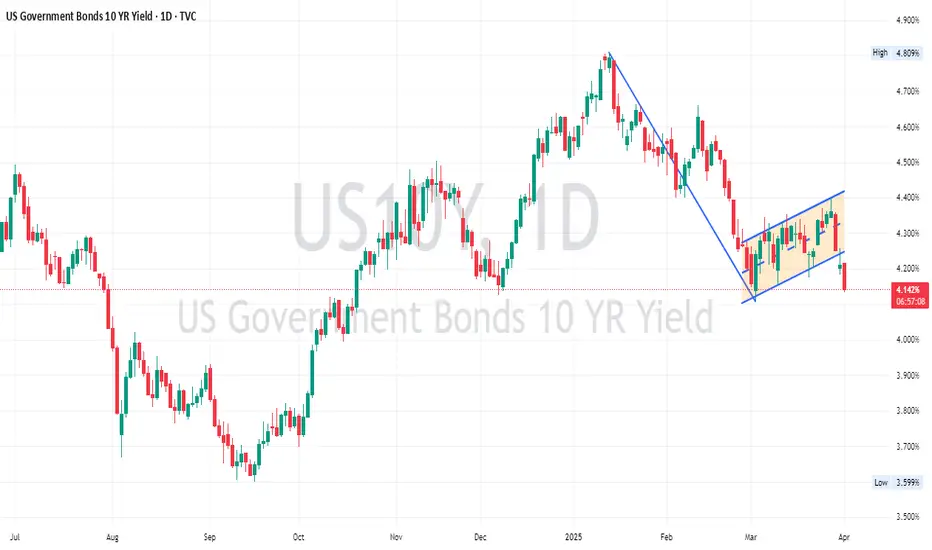
US 10Y Yield – Wave 4 Pause Before the Final SurgeDisclaimer: This analysis is for educational purposes only and does not constitute investment advice. Please do your own research (DYOR) before making any trading decisions.
The Setup
The US 10-year yield has been consolidating after topping near 5.021%. Price action since then has formed a contracting structure that looks very much like a Wave 4 triangle .
At present, yields hover near 4.0% — a crucial pivot.
Triangle view: Wave 4 is complete, setting the stage for Wave 5 higher.
Flat view: If yields break below 4.0%, Wave 4 may stretch deeper into a flat correction, potentially testing 3.6–3.7%.
Either way, the Elliott script points to one more advance: Wave 5 up .
What Wave 5 Could Mean
If the US 10-year yield really enters Wave ⑤ up, buckle up:
Bond prices tank → inverse relation, so Treasuries bleed.
Equities feel the heat → higher yields = expensive valuations, especially for growth stocks.
Dollar flexes → global FX could see USD strength.
Borrowing costs bite → mortgages, corporate loans, government debt servicing all tighten.
In short: Wave ⑤ = a macro “stress test .”
Why India Should Care
A breakout in US yields rarely stays a US-only story. For India, it means:
FII outflows as global funds chase safer US returns
INR under pressure , increasing imported inflation risks
Indian bond yields rising , even without RBI action
Equity market stress , especially in IT and rate-sensitive sectors
Final Thoughts
The triangle scenario points to an imminent breakout above 5.0%. A deeper flat only delays it. For traders and investors, this is the chart to watch — because Wave 5 in US yields isn’t just a bond market story, it’s a global macro shockwave .
Part 3 Trading Master ClassIntroduction
Options trading is one of the most fascinating and versatile aspects of the financial markets. Unlike stocks, which give ownership in a company, or bonds, which provide fixed income, options are derivative instruments whose value is derived from an underlying asset such as stocks, indices, commodities, or currencies. They give traders the right, but not the obligation, to buy or sell the underlying asset at a predetermined price before a specific expiration date.
Because of this unique characteristic, options allow traders and investors to design strategies that suit a wide range of market conditions—whether bullish, bearish, or neutral. Through careful strategy selection, one can aim for limited risk with unlimited upside, hedge existing positions, or even profit from sideways markets where prices don’t move much.
This article explores options trading strategies in detail. We’ll cover the building blocks of options, common strategies, advanced combinations, and risk management. By the end, you’ll have a strong foundation to understand how professional traders use options to manage portfolios and generate returns.
Risk Management in Options Trading
Options carry significant risks if misused. Successful traders emphasize:
Position Sizing: Never risk too much on one trade.
Diversification: Spread across multiple strategies/assets.
Stop-Loss & Adjustments: Exit losing trades early.
Implied Volatility (IV) Awareness: High IV increases premiums; selling strategies may be better.

Part 2 Master Candlestick PatternAdvanced Strategies for Experienced Traders
If you’ve mastered the basics, here are some advanced setups:
Bull Call Spread → Buy 1 Call, Sell higher strike Call.
Bear Put Spread → Buy 1 Put, Sell lower strike Put.
Butterfly Spread → Profit from low volatility (range-bound market).
Calendar Spread → Buy long-term option, sell short-term option.
These strategies help balance risk vs reward.
SEBI Regulations & Margins
In India, SEBI ensures options trading is safe:
Option sellers must keep high margins.
Brokers must collect upfront premiums.
Intraday exposure limits are monitored.
This protects retail traders from excessive risks.

US 10 YEAR BOND YIELD HEAD TO MOONBuckle Up, the situation looks perilous and such high interest rate will break the backbone
THE KING TRADER

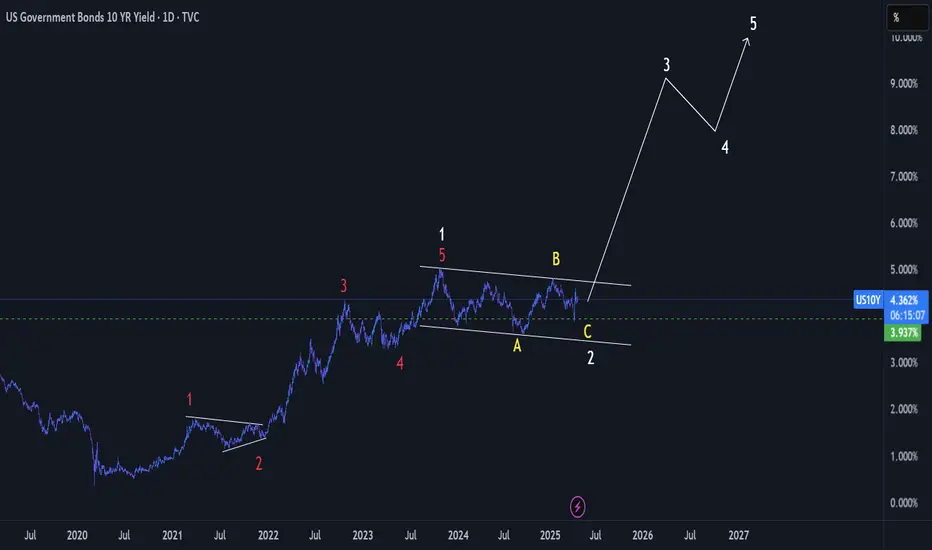
US- 10 YR Yield - Upside Push - 3rd WaveUS 10 Year Yield is showing a near term completion of 2nd wave (corrective wave) and 3rd wave might start within few weeks or before indicating a higher yield push to the range of 9%.
Bear Flag materializing in US 1O Year Yield (US10Y)US 10 Year yield suggests markets are moving towards risk off environment.
The fundamental causes for yields to fall are complex and difficult to disentangle - geopolitics, macro reasons, uncertainty, inflation risk, recession risk etc.
This will further put pressure on Stock Markets (equities).
The current trend looks bearish for US10Y.
Trade Safe
$US10YR - Potential Double Head & Shoulders Pattern Forming FPMARKETS:US10YR - Potential double head and shoulders pattern on the Daily Chart. This could align with Trump's lower rates initiative. We are seeing some weakness coming into employment data, seems like CPI and PPI are showing progress on inflation. The smaller Head & Shoulders pattern has a measured move to around 4.23% right at the 200 SMA (yellow) and the larger Head & Shoulders pattern measured move is 3.70%. This could take several months to play out since this is a daily chart. All eyes on this Friday's PCE and Non-farm payroll first week of February. I think we will have favorable PCE numbers YoY in February and March which could help the fed take their eyes off inflation and focus on jobs numbers, allowing them to cut. The market is pricing in 1.5 cuts this year. I think we will see 3-4 cuts.

US10 Yrs. Bond Yield Form H&S pattern.As per H&S chart pattern, It may correct up to 4.24%, It means Nifty may bounce from here.

US10Y Analysis : Possibility of higher for longer
Historical Context and Key Observations :
From its peak in 1981 (~15%), the US10Y yield entered a multi-decade downtrend, consistently staying below its 20-month, 50-month, and 200-month moving averages due to disinflationary pressures and accommodative monetary policies. However, after reaching historic lows (~0.5%) in 2020 amid COVID-19-induced easing, the yield saw a sharp reversal, breaking above these key averages for the first time in over four decades, signaling a potential structural shift. Currently, the yield remains firmly above the 20M (4.19%), 50M (3.07%), and 200M (2.57%) moving averages, with their steep upward slopes highlighting the strong bullish momentum.
Technical Analysis :
The US10Y yield has shown a strong bullish reversal, breaking above the 20M, 50M, and 200M moving averages for the first time in over four decades, with the 20M forming a "golden cross" above the 50M and 200M, signaling robust momentum. The MACD is in positive territory with a rising histogram, further confirming the long-term trend reversal since 2021. Key support levels lie at the 50M (~3.07%) and 200M (~2.57%) moving averages, while resistance may emerge near the psychological 5% level, last seen consistently in 2007. Despite the parabolic rise from 2020 lows, consolidation or a pullback may occur before the uptrend resumes.
Fundamental Factors Driving Yields :
The US10Y yield has reversed its decades-long downtrend since 2020, driven by inflationary pressures from post-pandemic recovery, fiscal stimulus, and supply chain disruptions, prompting aggressive Federal Reserve rate hikes and expectations of "higher for longer" policies. Strong economic growth and resilient labor markets have reduced demand for safe-haven assets like Treasuries, while increased U.S. debt issuance and global liquidity tightening further contribute to rising yields. Currently above key moving averages (20M, 50M, and 200M), the yield signals strong bullish momentum, though near-term consolidation or pullbacks may occur before the uptrend resumes.
Conclusion :
The US10Y yield appears to be in the early stages of a structural shift from its decades-long downtrend. Key technical signals, including the break above long-term moving averages and bullish momentum in the MACD, suggest that the upward trend may continue. However, near-term consolidation is possible, especially given the sharpness of the recent rise.
Potential Scenarios:
1. Bullish Case: Sustained economic resilience, sticky inflation, or additional Fed rate hikes could push yields toward 5% or beyond.
2. Bearish Case: A dovish Fed pivot, recession risks, or flight-to-safety events could see yields retesting support at the 50M and 200M moving averages.

US10Yrs. Bond Yield parallel channel. Nifty up move confirmationUS Government 10Yrs. Bond Yield trading in parallel channel. After fake break out it come down in channel again. As per chart it may correct up to 4%,3.79% and 3.06% level soon.
It has inverse relation with index, so nifty and bank nifty may give good up move in next 2-3 months as both charts suggested also the same.

US 10 YEAR YIELD NEXT WHATUS 10 year yield now encountering 2 heavy supply zones.once it is taken out then it may target my SL HUNTING LINE at 4.68.
only if it reverses below the blue line & break the TL and atleast stays for 1/2 days it will become bearsih.
but again support zone is at 4.388.
For me it will go and touch the SL hunting line first.
lets see

#US10Y YIELD - TESTING MAOR SUPPORT - YIELD PAIN STILL LEFT?????As we can see, US 10y yield is retesting major support, which was held last time. If this holds then we are about to retest the recent highs in coming months. Major resistance 5.00. Break below 3.2 levels will start new downtrend otherwise we are heading much higher.
Fingers Crossed!!! I feel we are in for a bumpy ride ahead.

Recession Risks and Market CautionIn July 2022, we saw the yield curve (US 10-year Treasury vs the US 2-year Treasury) go negative. It’s been in that zone ever since, and now, as we approach the two-year mark, we’re on the brink of positive territory.
An inverted yield curve has a well-documented history of signalling recession. When you factor in the PMI readings dropping below 50, rising unemployment rates, and NASDAQ already in correction mode with a 10% drop from its peak, the message is clear.
So, what’s the takeaway? The indicators are pointing towards a potential recession and bear market. It’s wise to proceed with caution as these signals suggest we might be heading into choppy waters.

A bond market rally is now clearAfter rising inside a channel, the US 10-year bond yields are breaking the rising channel for wave B on the downside. This confirms the start of wave C down for bond yields. In terms of levels, it means eventually going back to maybe 3% in the US 10-year note, as wave C will break the neckline at 3.8%. So this will be a multi-month decline in bond yields, resulting in a long bond rally. We broke the rising channel at 4.45% so that is the key resistance here.
