A bond market rally is now clearAfter rising inside a channel, the US 10-year bond yields are breaking the rising channel for wave B on the downside. This confirms the start of wave C down for bond yields. In terms of levels, it means eventually going back to maybe 3% in the US 10-year note, as wave C will break the neckline at 3.8%. So this will be a multi-month decline in bond yields, resulting in a long bond rally. We broke the rising channel at 4.45% so that is the key resistance here.
US Government Bonds 10 YR Yield
No trades
Market insights
US 10 YEAR BOND TREND nowTREND - NUETRAL .because now at down and up TL juction.
PRESENT ZONE- At DEMAND ZONE 1.
FORECAST -As per ZONE once downward TL crosses and closes above At DEMAND ZONE 1 will target SUPPLY ZONE 1 at 4.643.
If not will target DEMAND ZONE 2
MY TAKE - will target 4.643 the SUPPLY ZONE 1.
But any news flow may change this scenoria.
IMPORTANCE OF US 10 YEAR BOND is once it moves up Dollar will go up.Rupee goes down along with equity markets.so always keep track on this always.
US10Ythe fall started from 15% in Oct' 1981 until 0.533% in Jul 2020 has formed a parallel channel.
Though the rise has been sharp and with very little consolidation.
However it may start consolidating from 6-8%
retracement from that may not be much, however time correction is needed as bond yield has increase too much in little time.
2024 March April started a huge crash in equity market 2024 march April started a huge recession in equity market according to bond market when 10 year bond yields and 2 year bond yields curve at base line o it men's recession this economy indicator pridict right pridition back 40 year . Look at the example the greatest tech burst crash in 2000 and subprime mortgage crash 2008 and pendmic crash 2020 . This economy indicator pridict earlier this huge crash .
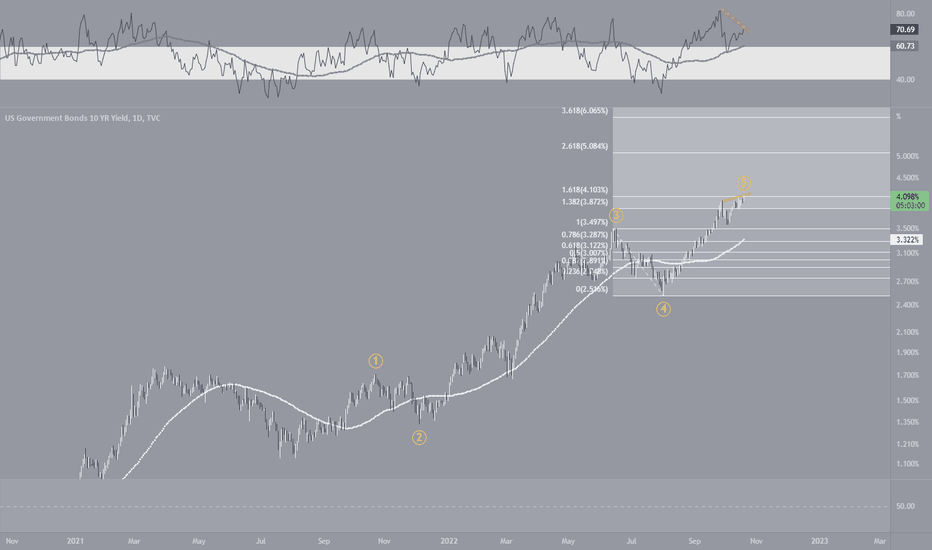
US 10 Year Bonds and Notes yield topping outA truncated 5th wave maybe developing in the US 10-year bond yields as the pattern that has developed is an expanding triangle near a double top. Positioning shows the largest short position in US bonds net across categories. The setup is for a short covering rally in bond markets to be triggered by some event along with inflation data. This is not a time to be bearish bonds or bullish yields, but the exact opposite
Will bond spike again ?Bond yield looks to have bottomed out at 1.12. Daily close abv 1.38 will start bullish HHHL structure. In such scenario , price may adance to 2.02 (minimum) on conservative slope and 2.34 - 2.60 on steep slope.
Minimum deadline as of now is 22nd Jan but if it attempts for 2.60 then deadline could extend to May 2022.
Yield spreads favor EUR longsThe spread between the 10-year US and German government bond yields has dropped below a macro bullish trendline, characterizing the widening since 2008.
In other words, the market says the era of US rates being higher than German rates is passe! And therefore, holding EUR shorts is risky.
US10Y - Looks like a high is completedUS10Y could be in at its peak in current wave cycle to stary a ABC correction.
RSI on daily is also showing divergence indicating topping out sign. The correction in US10 will be good for equities.
View will be invalid if the high 4.123 is broken and wave 5 might get extended.
User discretion!
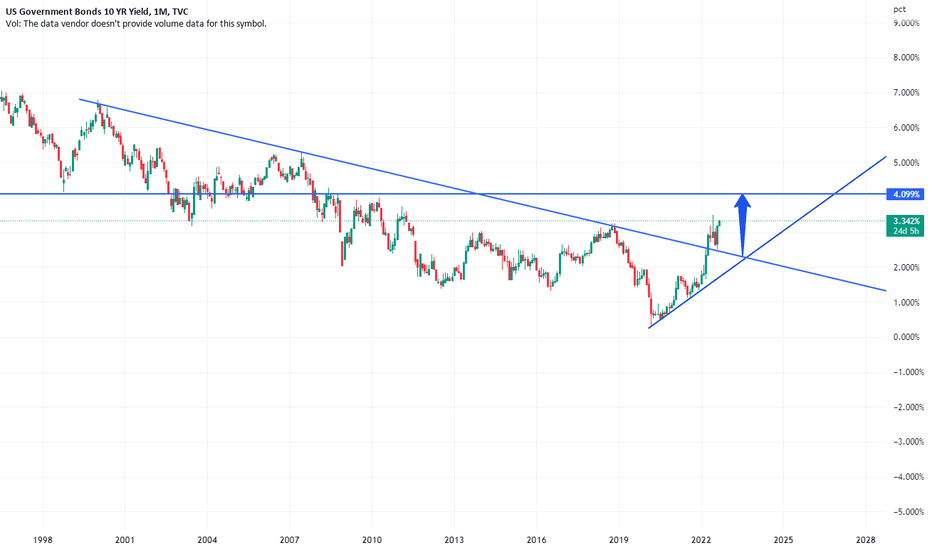
Rounding bottom (Cup & Handle) formation breakout?? #US10YCharts show breakout of rounding bottom formation on Weekly/Monthly charts of US 10year yields. Already got monthly closing above the breakout line.
If sustains above the breakout line minimum target for 10y yield will be around 5.5/6.5 pc. If so, there will bloodbath across all asset classes. Only below 3.4/3.3 negates the idea.
Brace! Brace! Brace! If true, difficult times ahead.
Hope I'm wrong.
Happy trading
Recession Incoming? Here is what the technicals say
US10Y-TVC:US02Y
Economists: Recession incoming!
World Leaders: Recession is out of the books.
Whom to believe? Here is my analysis from a technical standpoint👇
As someone who believes in data driven decision making, the technicals point towards a recession. How so?
When the difference between the 10 year bond yield and 2 year bond yield becomes negative, it is known as an 'Inversion in bond yield curve' and this inversion has been a strong indicator in predicting recession.
Since this chart (US10Y-US02Y) started back in 1976, whenever the curve went into the negative zone, we experienced a recession shortly after.
So the question now is, are we in the negative zone? YES!
Recession incoming? Most likely yes!
To all my connections in the field of finance especially, I'd love to know your thoughts on the same below in the comments 👇
Follow AVZ_Trades for more such content
#finance #data #recession #bonds


