ready to move down Eurusdaccumalted enough liqyidity buyers trapped , ready for sharp downfall, get ready for position OANDA:GBPUSD
Trade ideas

Sell Trade - EUR/USDGreetings to everyone!
You can place a sell trade on EUR/USD and check out my chart for the ideal entry, stop-loss & target placement.
Remember :-
* Move your SL to breakeven once the trade reaches 1:1 R.
* Aim for a minimum reward of 1:1.5 R.
* Don't risk more than 3% of your total margin.
Let's execute this trade smartly! 🚀
💬 About Me:
I am a professional trader with over four years of experience in the markets. I focus on swing trading using the 4H timeframe, mainly in the forex space. The trades I share here are the actual positions I’m executing. I post them as a small gesture to give back to the trading community that’s been a big part of my journey.
Cheers! 🙏

Part 9 Trading Master ClassOption Expiry and Settlement
Every option contract has a fixed expiry date, after which it becomes invalid. In India, for example, index options like NIFTY and BANKNIFTY expire weekly or monthly, while stock options usually have monthly expiries.
There are two types of settlements:
Cash Settlement: The difference between the strike and market price is credited or debited in cash (used in index options).
Physical Settlement: The actual delivery of stocks occurs (used in stock options in India).
Understanding expiry cycles is crucial, as price movements near expiry can become highly volatile due to time decay and traders closing positions.

EURUSD Outlook: Dollar Dominance Extends as Euro WeakensThe EURUSD pair remains under downward pressure as investors continue favoring the U.S. dollar amid global economic uncertainty. The Federal Reserve’s consistent stance on keeping interest rates higher for longer has reinforced the dollar’s appeal, while weak Eurozone data — including sluggish industrial output and fading consumer confidence — has weighed on the euro’s recovery.
Market sentiment shows limited bullish strength for the euro, with traders closely monitoring upcoming U.S. inflation and ECB policy comments. Unless the Eurozone presents stronger economic momentum or fiscal support, the euro is likely to remain on the defensive.
Overall, the fundamental tone supports continued USD dominance. The broader market structure reflects bearish tendencies for EURUSD in the medium term, with investors preferring dollar exposure as a safer bet amid global uncertainty.

Part 1 Support and Resistance How Option Trading Works
Let’s take a simple example:
You buy a Call Option for Reliance Industries with a strike price of ₹2,400, expiring in one month.
The premium is ₹50 per share, and the lot size is 250 shares.
So, your cost = ₹50 × 250 = ₹12,500.
If the stock price rises to ₹2,500 before expiry, your option becomes profitable.
You can either exercise your right to buy at ₹2,400 (and immediately sell at ₹2,500), or you can sell the option itself in the market for a profit.
If the stock stays below ₹2,400, your option will expire worthless, and your loss will be limited to the premium paid (₹12,500).


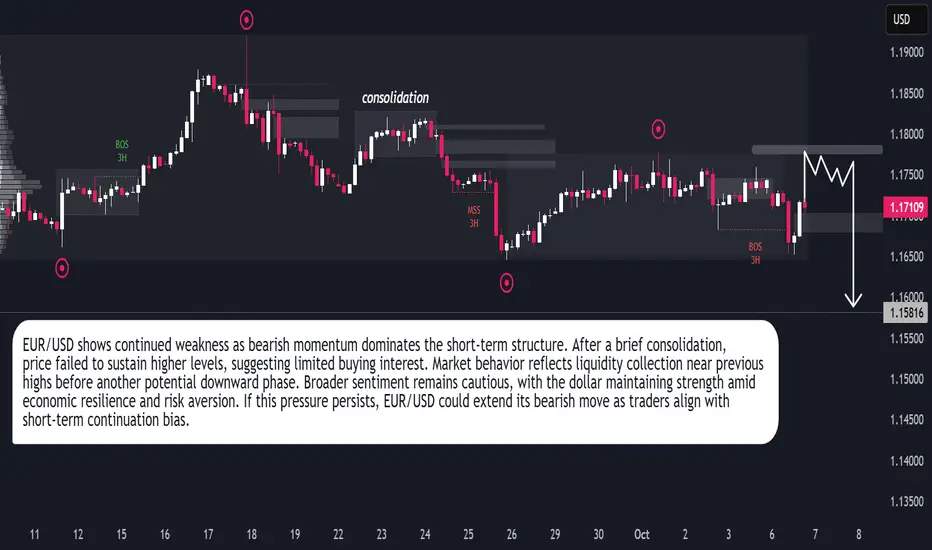
EUR/USD – Bearish Continuation in MotionEUR/USD continues to display a bearish market structure, reflecting persistent downside pressure as the euro struggles to maintain stability against the U.S. dollar. Recent price action shows a period of consolidation followed by a liquidity grab near short-term highs, indicating that buyers are losing strength and the market is positioning for a potential continuation of the decline. The broader market tone suggests that sentiment remains cautious, with traders favoring the dollar due to its resilience amid global uncertainty and steady U.S. economic performance. The pair’s inability to establish higher highs further confirms weakness in bullish momentum. This behavior often signals distribution, where institutional players offload long positions before another leg downward. Short-term movements could still present small corrective bounces as the market seeks liquidity, but overall conditions favor sellers. Unless a strong shift in macro sentiment occurs, EUR/USD is likely to maintain its downward trajectory, targeting lower levels as the bearish momentum unfolds and traders continue aligning with dollar strength.
Part 4 Learn Institutional Trading Option trading is a type of derivative trading where traders buy or sell the right (but not the obligation) to buy or sell an underlying asset—like stocks, indices, or commodities—at a specific price before a certain date.
Two Main Types of Options
Call Option: Gives the holder the right to buy the asset.
Put Option: Gives the holder the right to sell the asset.
Key Participants
There are two sides in an options trade:
Buyer (Holder): Pays a premium for the right to trade.
Seller (Writer): Receives the premium and has an obligation to fulfill the contract if exercised.

EURUSD - SELL SETUP EURUSD – Clean SELL Setup Ahead 🧠📉
📍 Bias: Short
📍 Pair: EUR/USD
🕒 Timeframes: 1H | 4H | Daily | Weekly
🧭 Multi-Timeframe Outlook
EURUSD is showing bearish structure on the 4H and 1H, while the Daily and Weekly remain bullish — giving us a potential short-term corrective opportunity.
At the same time, the Dollar Index (DXY) remains strong, with room for further upside spikes. This adds confluence for short plays on EURUSD.
📊 Key Technical Zone
The Fibonacci retracement 0.50–0.61 zone is aligning beautifully with a bearish Order Block + FVG, creating a high-probability sell area.
📌 Sell Zone: 1.17440 – 1.17150
🧱 Confluence: OB + FVG + Fib Zone
⛔️ Stop Loss: 1.17675
This setup provides a structured short opportunity on retracement, rather than chasing the move.
📝 Execution Plan
1️⃣ Wait for price to retrace into the 1.17440–1.17150 zone.
2️⃣ Look for lower timeframe (LTF) structure shift confirmations (1m–15m) inside the zone.
3️⃣ Execute shorts on clean breaks or bearish fractal structures.
4️⃣ Keep SL above 1.17675 and manage positions based on your RR.
🎯 This setup focuses on timing entries at premium levels with DXY strength as a strong macro tailwind.
⚠️ Final Note
This is a retracement-based short play within a higher-timeframe bullish market — meaning quick reaction and precise execution are key.
📉 Let the market come to your zone… then strike with structure, not emotions.
#EURUSD #SmartMoneyConcepts #FVG #OrderBlocks #ForexTrading #PriceAction #TradingView

EURUSD – Bearish Setup (H2 Chart)📊 EURUSD – Bearish Setup (H2 Chart)
Pair: EURUSD
Timeframe: 2H
Bias: Short Position
🔎 Market Context:
EURUSD is currently testing a resistance zone (1.17485 – 1.17888).
Momentum shows signs of slowing down near this level, with potential seller interest.
If rejection confirms, price could continue lower towards previous support.
📌 Trade Plan:
Entry Zone: 1.17485 – 1.17888
Stop Loss (SL): Above 1.17888
Take Profit (TP): 1.16309 (recent low / support zone)
⚖️ Risk-Reward (RR):
Approx 1:3, aligning with next week’s trading plan.
📅 Setup valid for Oct 6 – Oct 10, 2025
⚠️ Disclaimer: This chart is shared for educational purposes only, not financial advice. Always use proper risk management when trading.

Euro Dollar Analysis – Corrective Rebound or Bearish Setup?EUR/USD continues to operate within a controlled market cycle. The sharp decline earlier this week highlighted strong bearish momentum, followed by a corrective rebound that served as a liquidity reset. This rebound is less about trend reversal and more about rebalancing order flow after an aggressive selloff.
The current structure suggests the market may still seek liquidity higher before resuming its dominant direction. A sweep toward the 1.1780 area could attract late buyers, providing larger players the opportunity to offload positions before driving price lower again.
Overall, EUR/USD remains tilted toward the downside. The corrective phase is acting as a preparation stage, positioning the pair for another potential bearish leg once redistribution completes.

$EURO - AMD FORMATION Let's see can we get this AMD FORMATION on LSE:EURO , Targeting the Seller Side Liquidity, PA looks much cleaner to me on H1.
Need a breakdown of this Trade follow me on X can't post it there it's took multiple charts to published.

EURUSD MULTI TIME FRAME ANALYSISHello traders , here is the full multi time frame analysis for this pair, let me know in the comment section below if you have any questions , the entry will be taken only if all rules of the strategies will be satisfied. wait for more price action to develop before taking any position. I suggest you keep this pair on your watchlist and see if the rules of your strategy are satisfied.
🧠💡 Share your unique analysis, thoughts, and ideas in the comments section below. I'm excited to hear your perspective on this pair .
💭🔍 Don't hesitate to comment if you have any questions or queries regarding this analysis.

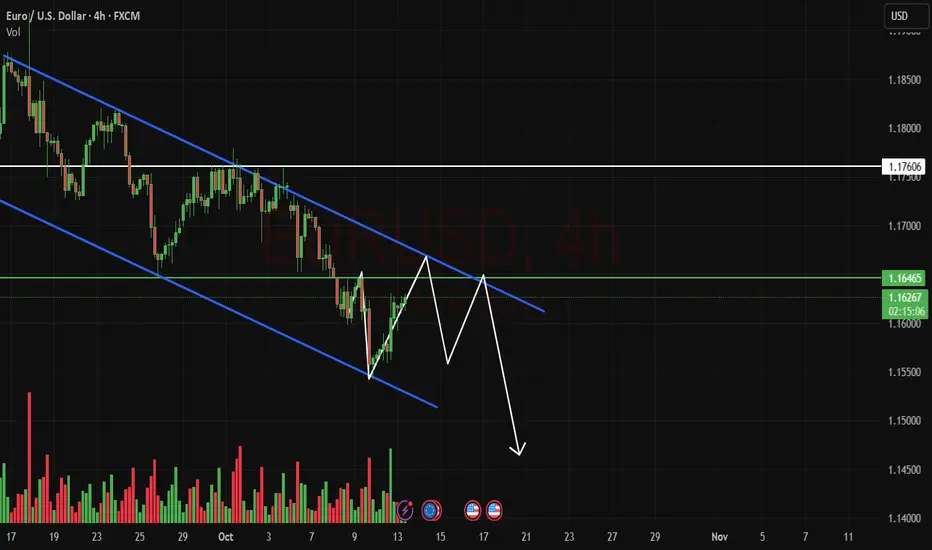
EURUSD – Head and Shoulders Breakdown in Play!!The chart is showing a clear Head and Shoulders formation, a bearish reversal structure that signals the market may be preparing for a deeper drop if neckline support gives way.
Chart validation:
Left Shoulder, Head, and Right Shoulder are well-defined.
The neckline sits around 1.1646 – this is the critical level to watch.
Current price is hovering above the neckline, but pressure is building on the downside.
Invalidation sits above 1.1850 – if price pushes past this level, the bearish setup is negated.
Targets from the structure:
A clean break below 1.1646 confirms the pattern.
Measured move points towards 1.1430 area as the downside objective.
Along the way, short-term jolts could test 1.1550, but the major momentum favors sellers if neckline breaks.
Trading view:
As long as EURUSD stays below the right shoulder resistance and 1.1850, bias leans bearish. The neckline is the trigger – once broken, the head and shoulders formation comes into full effect, opening space for a sharper correction.Trade safe !!

EURUSD Sell Setup – Multi-Timeframe ConfluenceEURUSD Sell Setup
📍 Bias: Short-Term Bearish (4H)
📍 Pair: EUR/USD
🔑 Market Context
On the Daily timeframe, EURUSD still holds a bullish structure.
But on the 4H timeframe, the market is showing clear bearish momentum.
The US Dollar Index (DXY) continues to strengthen, adding weight to a potential downside move.
📉 Bearish Confluence
Fractals: Currently bearish, showing downside pressure.
4H Trend: Confirmed bearish, rejecting from key supply levels.
Liquidity: Upside liquidity swept, favoring bearish continuation.
🎯 Trade Plan – Short Setup
Entry Zone: Current 4H breakdown levels.
Stop Loss: Above 1.18250
Target 1: 1.16565
Target 2: 1.15680
📝 Idea: Although the higher timeframe is bullish, the short-term structure and USD strength align for a clean downside play. Watch for rejection candles or bearish retests for confirmation.
⚠️ Risk Note
Always manage risk per your plan—this is a short-term tactical sell setup against the Daily trend.

EUR/USD is entering a decisive SMC zone – Big move loading...📊 EUR/USD H4 – SMC Mapping & Trading Plan
1. Market Structure
Main trend: bearish (after clear CHoCH and BOS).
Price has formed Equal Highs (EQH) → strong liquidity above.
Untested liquidity zone below (OBB) → expectation for price to sweep down.
2. Key Zones
Supply Zone (OBS + FVG):
1.18100 – 1.18200
This supply aligns with the Fair Value Gap.
Expecting price to retest this zone and reject downward.
Demand Zone (OBB):
1.16500 – 1.16650
Strong demand zone combined with liquidity resting below previous lows.
3. Trade Logic (SMC Flow)
Scenario 1 (Short Setup):
If price reaches the OBS + FVG (1.1810 – 1.1820) area,
Expect bearish reaction → Sell setup.
SL: above 1.1830.
TP: demand zone at 1.1650.
Scenario 2 (Long Setup after liquidity sweep):
If price taps into OBB (1.1650 – 1.1665) and holds,
Expect bullish reaction → Buy setup targeting 1.1750 – 1.1780.
SL: below 1.1630.
4. Market Psychology
Buy side: attempting to push higher but likely just a pullback to fill FVG and sweep liquidity above EQH.
Sell side: in control after BOS to the downside, targeting demand below.
Flip Zone: once supply is broken, it may flip into a new reaction zone (support).
✅ Summary Plan
Sell Zone: 1.1810 – 1.1820 → TP 1.1650
Buy Zone: 1.1650 – 1.1665 → TP 1.1750

#EURUSD - PLANLooking for a short on EURO after sweeping the Daily TF FVG possible reversal during NY Open

Sell Trade - EUR/USDGreetings to everyone!
You can place a sell trade on EUR/USD and check out my chart for the ideal entry, stop-loss & target placement.
Remember :-
* Move your SL to breakeven once the trade reaches 1:1 R.
* Aim for a minimum reward of 1:1.5 R.
* Don't risk more than 3% of your total margin.
Let's execute this trade smartly! 🚀
💬 About Me:
I am a professional trader with over four years of experience in the markets. I focus on swing trading using the 4H timeframe, mainly in the forex space. The trades I share here are the actual positions I’m executing. I post them as a small gesture to give back to the trading community that’s been a big part of my journey.
Cheers! 🙏

Option Trading Complete Guidence1. Introduction to Option Trading
Option trading is one of the most powerful and flexible tools in financial markets. Unlike buying stocks directly, where you simply own a share of a company, options allow traders to speculate, hedge, and leverage positions without necessarily owning the underlying asset. They are part of a broader group of financial products called derivatives, meaning their value is derived from an underlying asset like stocks, indices, commodities, or currencies.
At its core, an option is a contract that gives the buyer the right, but not the obligation, to buy or sell an underlying asset at a predetermined price (strike price) within a specified time. The seller (or writer) of the option, however, takes on the obligation to fulfill the contract if the buyer decides to exercise it.
2. Call Options and Put Options
Options come in two main types:
Call Option: Gives the buyer the right to buy the underlying asset at the strike price before expiry. Traders use calls when they expect the price to rise.
Put Option: Gives the buyer the right to sell the underlying asset at the strike price before expiry. Traders use puts when they expect the price to fall.
Example: If you buy a call option on Reliance at ₹2,500 with one month to expiry, and Reliance rises to ₹2,700, you can buy it cheaper (₹2,500) while the market trades higher. Conversely, if the price falls below ₹2,500, you can simply let the option expire, losing only the premium you paid.
3. Premium – The Cost of Options
The price of an option is called the premium. It is the amount the buyer pays to the seller for the rights the option provides. The premium is influenced by several factors, including:
Underlying Price – The closer the stock is to the strike price, the more valuable the option.
Time to Expiry – More time means more opportunity for movement, so longer-dated options cost more.
Volatility – High volatility increases the premium since the probability of hitting profitable levels rises.
Interest Rates & Dividends – Affect option pricing, though impact is usually smaller in stock options.
4. How Options Differ from Stocks
Unlike stocks, where risk is unlimited on the downside (the stock could fall to zero), option buyers’ risk is limited to the premium paid. For sellers, however, risk can be much larger. Another big difference is leverage. With relatively small capital, option traders can take large positions, magnifying potential gains and losses.
5. American vs. European Options
American Options: Can be exercised anytime before expiry. (Used in US equity markets.)
European Options: Can only be exercised at expiry. (Used in India’s NSE index options like NIFTY and BANKNIFTY.)
6. Uses of Options
Options are versatile and serve multiple purposes:
Speculation – Traders bet on short-term price movements.
Hedging – Investors use options to protect against adverse moves in their portfolios.
Income Generation – By selling options, traders collect premiums to earn steady returns.
Leverage – Amplify exposure with smaller capital.
7. Option Buyers vs. Option Sellers
Buyer: Pays premium, has limited risk, unlimited profit potential (in theory).
Seller (Writer): Receives premium, has limited profit (premium received), potentially unlimited loss.
This asymmetry makes options attractive to aggressive buyers and income-seeking sellers.
8. Factors Affecting Option Pricing (The Greeks)
Options pricing involves mathematical models like the Black-Scholes Model, but traders often rely on "Greeks" to understand risk:
Delta: Sensitivity to underlying price movement.
Gamma: Rate of change of Delta.
Theta: Time decay – options lose value as expiry approaches.
Vega: Sensitivity to volatility.
Rho: Sensitivity to interest rates.
Example: An option with high Theta loses value rapidly as expiry nears if the underlying doesn’t move.
9. Simple Option Strategies
Beginners usually start with these basic plays:
Buying Calls – Bullish outlook.
Buying Puts – Bearish outlook.
Covered Call – Owning stock + selling calls to earn premium.
Protective Put – Holding stock but buying a put as insurance.
10. Advanced Option Strategies
Professional traders combine multiple options to balance risk and reward:
Straddle: Buy both call and put at the same strike → Profits from large move in either direction.
Strangle: Similar to straddle, but strikes are different → Cheaper, wider profit range.
Bull Call Spread: Buy call at lower strike, sell call at higher strike → Limited profit, reduced cost.
Iron Condor: Selling out-of-the-money call and put while buying protection → Earns from low volatility.

EURUSD, NFP WEEKEU in a weekly looks good for sells
in Dialy tf we have a clean sell FVG at the place we have one 4H candle indicating that it need to go down in until the one 4H candle close in downwards direction
In entry time frame which is 15M have a clean engulfing candle at the sell FVG of 15M


EURUSD MULTI TIME FRAME ANALYSISHello traders , here is the full multi time frame analysis for this pair, let me know in the comment section below if you have any questions , the entry will be taken only if all rules of the strategies will be satisfied. wait for more price action to develop before taking any position. I suggest you keep this pair on your watchlist and see if the rules of your strategy are satisfied.
🧠💡 Share your unique analysis, thoughts, and ideas in the comments section below. I'm excited to hear your perspective on this pair .
💭🔍 Don't hesitate to comment if you have any questions or queries regarding this analysis.
