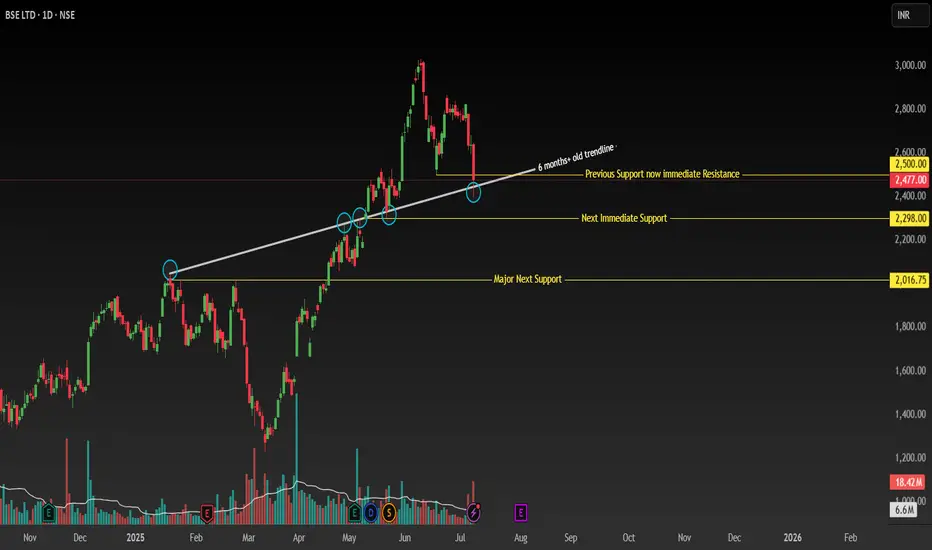
Symbol: BSE (Bombay Stock Exchange)
Timeframe: Daily
Key Levels:
✅ Breakdown: 2500 (closed below) → Next support: 2300 → 2000 (major).
✅ Bullish Anchor: Price > 200 MA + ascending trendline (Jan 20, 2025 breakout now support).
📊 Technical Structure
Critical Support Break:
-Daily close below 2500 (confirmed breakdown of key support).
-Next supports: 2300 (immediate) → 2000 (major swing low).
Bullish Anchors:
-Price above 200-day MA (long-term uptrend intact).
Ascending Trendline Support:
-Originating from Jan 20, 2025 (resistance until May 13 breakout).
-Now acting as dynamic support (resistance-turned-support).
Key Reversal Signal: Watch for reclaim of 2500
-Requires strong bullish candle + above-average volume.
-Confirms failed breakdown and resumption of uptrend.
🎯 Trading Plan
Scenario 1: Buy Dips (Conservative)
Entry Zone:
-Layer 1: 2300 (trendline + horizontal support confluence).
-Layer 2: 2000 (swing low + 200 MA reinforcement).
-Stop Loss: 1950 (below 2000 structure).
-Targets: 2500 → 2700 → 2900.
Scenario 2: Breakout Re-entry (Aggressive)
Trigger: Daily close above 2500 with: Bullish candle (preferably >1.5% gain).
-Volume ≥ 20% above 10-day average.
-Stop Loss: 2450 (below breakout level).
-Targets: 2700 → 2900 (measured move).
⚠️ Risk Management
Position Size: ≤3% capital per trade.
Invalidation Conditions:
-Close below 2000 (invalidates bullish thesis).
-Failed 2500 reclaim (weak volume/rejection candle).
Disclaimer: Not financial advice. Conduct your own due diligence. Past performance ≠ future results. Risk capital only.
🔥 Boost if this analysis helps your strategy!
💡 Comment below any stocks you want me to analyse next!
Disclaimer
The information and publications are not meant to be, and do not constitute, financial, investment, trading, or other types of advice or recommendations supplied or endorsed by TradingView. Read more in the Terms of Use.
Disclaimer
The information and publications are not meant to be, and do not constitute, financial, investment, trading, or other types of advice or recommendations supplied or endorsed by TradingView. Read more in the Terms of Use.