BTC 1H🧠 Market Context
Bitcoin has just completed a liquidity sweep after an extended move, tapping into a high-timeframe supply/demand reaction zone. Price action is currently compressing, signaling that we’re approaching a decision point where momentum traders and HTF participants collide.
The recent
Key stats
About Bitcoin
Bitcoin is the world’s most traded cryptocurrency, and represents the largest piece of the crypto market pie. It was the first digital coin and as such, remains the most famous and widely-adopted cryptocurrency in the world. It's the original gangster in whose footsteps all other coins follow. The birth of Bitcoin was the genesis of an entirely new asset class, and a huge step away from traditional, centrally controlled money. Today, many advocates believe Bitcoin will facilitate the next stage for the global financial system, although this — of course — remains to be seen.
Related coins

BTC short term Semi Triangle Bearish Structure BTC keeps creating a bearish semi-triangle after recovery from 59.7k, suggesting bearish momentum is still in place. In order to create a bullish divergence btc needs to go down one more round, let's say around 57k, and print bullish RSI onthe daily, that will Create a chance for rellief Rally. Whic

BTC Reversal or still bearish (13/02/2026).BTC is trading in a parallel channel.
Major Trend :- Bearish
Minor Trend :- Range Bound.
A bearish scalp trade can be taken upto the support levels of the channel. With a SL being a candle closing above the channel.
If there are halt candle near the resistance levels and a BO occurs, a 1000 point

Weekly Analysis with buy/Sell scenarios in BTCAnother selling week. Price made low of 59977 and closed above ~70K. Overall BTC is still bearish and we may see further downfall after some pullback. ~74500 is critical level for pullback. ~55K is critical next level. We may witness a consolidation and reversals on 50K – 55K zone.
Price will remain

Part 1 Intraday Institutional Trading Strategies What Are Options? (Basic Definition)
Options are financial contracts that give the buyer the right (but not the obligation) to buy or sell an underlying asset (such as Nifty, Bank Nifty, stocks, commodities) at a pre-decided strike price, within a specific expiration time.
Two types of options:
1

Bitcoin at $69K: Relief Bounce or Setup for the Next Leg Lower?Bitcoin’s move back toward the $69,000 area may look constructive at first glance, but structurally it resembles a relief bounce inside a broader downshift, not the start of a new bullish expansion.
The recent price action shows a classic sequence:
a sharp drop, followed by a fast recovery into a p

Bybit chart analysis FEBURARY 12 Bitcoin
Hello
It's a Bitcoin Guide.
If you "follow"
You can receive real-time movement paths and comment notifications on major sections.
If my analysis was helpful,
Please click the booster button at the bottom.
This is a 30-minute Bitcoin chart.
The Nasdaq indicators will be released shortly at 10:

Bitcoin Bybit chart analysis FEBURARY 11Hello
It's a Bitcoin Guide.
If you "follow"
You can receive real-time movement paths and comment notifications on major sections.
If my analysis was helpful,
Please click the booster button at the bottom.
This is Bitcoin's 30-minute chart.
The Nasdaq indicators will be released shortly at 10:30

Bitcoin Bybit chart analysis FEBURARY 9Hello
It's a Bitcoin Guide.
If you "follow"
You can receive real-time movement paths and comment notifications on major sections.
If my analysis was helpful,
Please click the booster button at the bottom.
This is a Bitcoin 30-minute chart.
There are no separate Nasdaq indicators.
When the re

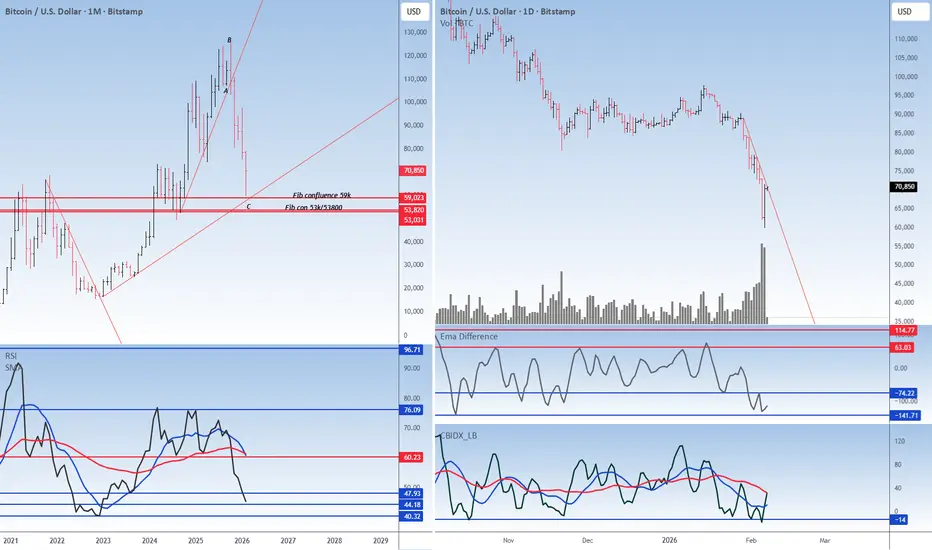
The crypto has found its supportBitcoin CMP $70690
The beauty of looking at various asset classes is that they rise and fall together. In my view the correction in the crypto is over.
Elliott- The v waves within the C wave is done. Hence to me this correction is over.
Fib- The crypto reversed just shy away from the 59K whic
See all ideas
Summarizing what the indicators are suggesting.
Oscillators
Neutral
SellBuy
Strong sellStrong buy
Strong sellSellNeutralBuyStrong buy
Oscillators
Neutral
SellBuy
Strong sellStrong buy
Strong sellSellNeutralBuyStrong buy
Summary
Neutral
SellBuy
Strong sellStrong buy
Strong sellSellNeutralBuyStrong buy
Summary
Neutral
SellBuy
Strong sellStrong buy
Strong sellSellNeutralBuyStrong buy
Summary
Neutral
SellBuy
Strong sellStrong buy
Strong sellSellNeutralBuyStrong buy
Moving Averages
Neutral
SellBuy
Strong sellStrong buy
Strong sellSellNeutralBuyStrong buy
Moving Averages
Neutral
SellBuy
Strong sellStrong buy
Strong sellSellNeutralBuyStrong buy
Displays a symbol's price movements over previous years to identify recurring trends.
Discover funds exposed to Bitcoin and find another way to access the coin.
Frequently Asked Questions
The current price of Bitcoin (BTC) is 68,845 USD — it has fallen −1.30% in the past 24 hours. Try placing this info into the context by checking out what coins are also gaining and losing at the moment and seeing BTC price chart.
The current market capitalization of Bitcoin (BTC) is 1.38 T USD. To see this number in a context check out our list of crypto coins ranked by their market caps or see crypto market cap charts.
Bitcoin (BTC) trading volume in 24 hours is 40.10 B USD. See how often other coins are traded in this list.
Bitcoin price has fallen by −0.58% over the last week, its month performance shows a −27.97% decrease, and as for the last year, Bitcoin has decreased by −29.40%. See more dynamics on BTC price chart.
Keep track of coins' changes with our Crypto Coins Heatmap.
Keep track of coins' changes with our Crypto Coins Heatmap.
Bitcoin (BTC) reached its highest price on Oct 6, 2025 — it amounted to 126,272 USD. Find more insights on the BTC price chart.
See the list of crypto gainers and choose what best fits your strategy.
See the list of crypto gainers and choose what best fits your strategy.
Bitcoin (BTC) reached the lowest price of 2 USD on Oct 20, 2011. View more Bitcoin dynamics on the price chart.
See the list of crypto losers to find unexpected opportunities.
See the list of crypto losers to find unexpected opportunities.
The current circulating supply of Bitcoin (BTC) is 19.99 M USD. To get a wider picture you can check out our list of coins with the highest circulating supply, as well as the ones with the lowest number of tokens in circulation.
Bitcoin has the limit of 21.00 M coins. No matter how the currency evolves, no new coins will be released after this number is reached.
The safest choice when buying BTC is to go to a well-known crypto exchange. Some of the popular names are Binance, Coinbase, Kraken. But you'll have to find a reliable broker and create an account first. You can trade BTC right from TradingView charts — just choose a broker and connect to your account.
Crypto markets are famous for their volatility, so one should study all the available stats before adding crypto assets to their portfolio. Very often it's technical analysis that comes in handy. We prepared technical ratings for Bitcoin (BTC): today its technical analysis shows the sell signal, and according to the 1 week rating BTC shows the sell signal. And you'd better dig deeper and study 1 month rating too — it's sell. Find inspiration in Bitcoin trading ideas and keep track of what's moving crypto markets with our crypto news feed.
Bitcoin (BTC) is just as reliable as any other crypto asset — this corner of the world market is highly volatile. Today, for instance, Bitcoin is estimated as 4.25% volatile. The only thing it means is that you must prepare and examine all available information before making a decision. And if you're not sure about Bitcoin, you can find more inspiration in our curated watchlists.
You can discuss Bitcoin (BTC) with other users in our public chats, Minds or in the comments to Ideas.