📊 Current Price & Range
Last traded around ₹1,669 – ₹1,672
Today’s observed intraday range so far: Low ~ ₹1,651.6 and High ~ ₹1,679.2.
Previous close was ~ ₹1,669.60.
🔍 Key Technical Levels (1-Day)
Support levels to monitor:
1. ~ ₹1,650 mark – near today’s intraday low (~1,651).
2. A stronger buffer may lie around ₹1,620-1,630, given prior trading zones (though exact MA data not fully pulled).
3. If price breaks decisively below ~₹1,650, the next meaningful lower zone might be nearer the 52-week low area (~₹1,100) but that’s much further away.
Resistance levels to monitor:
1. Immediate resistance near today’s high ~ ₹1,679-1,680.
2. If momentum builds, next resistance around ~ ₹1,700-₹1,720 area.
3. The 52-week high (~₹1,910) remains well above current price and acts as long-term cap.
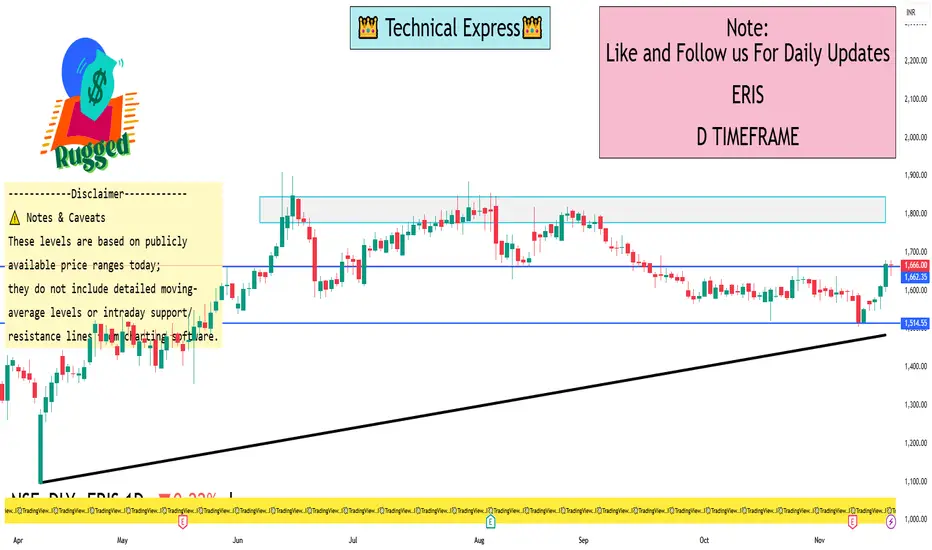
⚠️ Notes & Caveats
These levels are based on publicly available price ranges today; they do not include detailed moving-average levels or intraday support/resistance lines from charting software.
Always consider external risks: market sentiment, pharma sector news, regulatory updates, earnings surprises for Eris.
Short-term trading involves higher volatility and increased risk; these setups should be used with proper stop-losses and position sizing.
Last traded around ₹1,669 – ₹1,672
Today’s observed intraday range so far: Low ~ ₹1,651.6 and High ~ ₹1,679.2.
Previous close was ~ ₹1,669.60.
🔍 Key Technical Levels (1-Day)
Support levels to monitor:
1. ~ ₹1,650 mark – near today’s intraday low (~1,651).
2. A stronger buffer may lie around ₹1,620-1,630, given prior trading zones (though exact MA data not fully pulled).
3. If price breaks decisively below ~₹1,650, the next meaningful lower zone might be nearer the 52-week low area (~₹1,100) but that’s much further away.
Resistance levels to monitor:
1. Immediate resistance near today’s high ~ ₹1,679-1,680.
2. If momentum builds, next resistance around ~ ₹1,700-₹1,720 area.
3. The 52-week high (~₹1,910) remains well above current price and acts as long-term cap.
⚠️ Notes & Caveats
These levels are based on publicly available price ranges today; they do not include detailed moving-average levels or intraday support/resistance lines from charting software.
Always consider external risks: market sentiment, pharma sector news, regulatory updates, earnings surprises for Eris.
Short-term trading involves higher volatility and increased risk; these setups should be used with proper stop-losses and position sizing.
I built a Buy & Sell Signal Indicator with 85% accuracy.
📈 Get access via DM or
WhatsApp: wa.link/d997q0
Contact - +91 76782 40962
| Email: techncialexpress@gmail.com
| Script Coder | Trader | Investor | From India
📈 Get access via DM or
WhatsApp: wa.link/d997q0
Contact - +91 76782 40962
| Email: techncialexpress@gmail.com
| Script Coder | Trader | Investor | From India
Related publications
Disclaimer
The information and publications are not meant to be, and do not constitute, financial, investment, trading, or other types of advice or recommendations supplied or endorsed by TradingView. Read more in the Terms of Use.