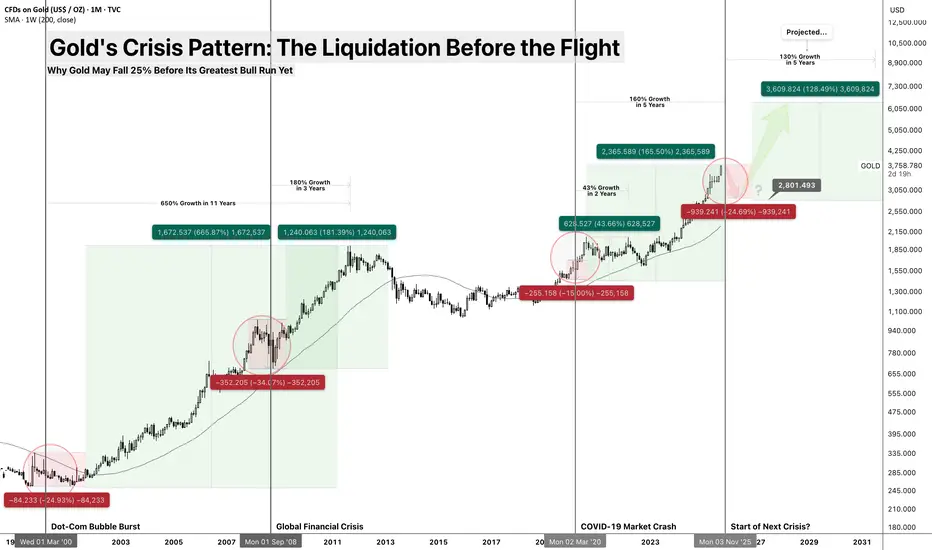
Why Gold May Fall 25% Before Its Greatest Bull Run Yet
While everyone expects gold to rally during the next crisis, history suggests something different: gold gets sold first, bought later. At $3,790,
Think of
The Crisis Liquidation Pattern
2000 Dot-Com Crisis:
- Pre-crisis peak: $326
- Initial drop: -21%
- Crisis bottom: $255
- Ultimate recovery: +650% over 11 years
2008 Financial Crisis:
- Pre-crisis peak: $1,033
- Initial drop: -34%
- Crisis bottom: $680
- Ultimate recovery: +180% over 3 years
2020 COVID Pandemic:
- Pre-pandemic peak: $1,696
- Initial drop: -15%
- Bottom-to-recovery: +43% over 2 years, +160% over 5 years
Key Distinction: Some will point to 2020, when
2025 Projection:
- Current peak: $3,790 (I think top already - might be wrong) ✓
- Expected initial drop: -20 to -25%
- Target bottom: $2,800-3,000
- Long-term recovery target: $6,500+ by 2030
Why
The Margin Call Cascade
When leveraged positions blow up, investors sell what they can, not what they want to.
The Three-Phase Liquidation:
- Phase 1: "This is just a correction" - Hold everything
- Phase 2: "I need cash now" - Sell winners (including gold)
- Phase 3: "The system is broken" - Buy gold as currency hedge
Think of it like a house fire: you don't grab the fire extinguisher first, you grab your wallet. Only after you're safe do you wish you'd saved the fire extinguisher.
What Makes 2025 Different?
Unprecedented Starting Point
 GOLD at all-time highs vs. GDP ✓
- Central bank buying at record levels
- Retail ownership through ETFs at maximum
- More holders means more potential sellers
The AI Deflation/Monetary Inflation Paradox
- AI driving productivity gains (deflationary)
- Debt levels requiring monetary expansion (inflationary)
- Gold benefits from the monetary side, but falls in initial deflationary shock
Geopolitical
- Central banks want GOLD for de-dollarization
- But financial stress forces private selling first
- Result: Temporary oversupply before structural shortage
The Crisis Timeline for Gold
Stage 1: The Setup (Now - Q4 2025)
- Strong dollar pressure
- Real yields rising with Fed cuts
- Still viewed as "risk asset" by algorithms
- Target Range: $3,400-3,600
Stage 2: The Liquidation (Q4 2025 - Q2 2026)
- Forced selling from leveraged funds
- ETF redemptions as retail panics
- Dollar
 DXY strength peaks
 - Target Bottom: $2,800-3,000
Stage 3: The Recognition (Q2 2026 - Beyond)
- Currency debasement fears return
- Physical shortage becomes apparent
- Central bank buying accelerates
- Ultimate Target: $6,500+ by 2030
Key Indicators to Watch
Immediate Danger Signals:
 GOLDSILVER ratio above 90(April 2025 100+) (currently 84 - expect further decline) ✓
- Dollar Index DXY climbs higher towards 110
- US10Y 10-year real yields above 4% (currently 4.17%)✓
Crisis Confirmation:
- GOLD falls below $3,200 on volume
- Mining stocks crash 40%+
- Central bank buying announcements increase
- Physical premiums start expanding
Recovery Signals:
- Dollar DXY weakening below 105
- Fed pivots to QE
- Inflation expectations rising
- GOLDSILVER Gold/Silver ratio normalizing
The Bigger Picture: Why This Sets Up Gold's Greatest Run
Structural Drivers Post-Crisis:
- Debt Monetization: $30+ trillion deficits requiring QE
- Currency Competition: Digital currencies vs. physical gold
- Supply Constraints: Peak gold production reached
- Generational Shift: Millennials discovering gold after getting burned in "everything bubble"

Historical Precedent:
After every major financial crisis, gold enters its strongest bull market:
- Post-1971: +2,300% over 9 years
- Post-1999: +650% over 11 years
- Post-2008: +180% over 3 years
- Post-2025: Targeting +150-200% over 5-7 years
Risk Management
This Analysis Fails If:
- Fed pivots to massive QE immediately (before crisis)
- Fiscal stimulus exceeds $3 trillion rapidly
- Dollar collapses before financial crisis hits
- War/geopolitical crisis becomes primary driver
Probability Assessment:
- 65%: GOLD falls to $2,800-3,200 range before rallying
- 25%: GOLD holds above $3,400 and rallies immediately
- 10%: GOLDZ2025 crashes below $2,500 in systemic crisis
Conclusion: The Pain Before the Gain
Like Warren Buffett said: "Be greedy when others are fearful." When gold is getting panic-sold alongside everything else, that's when the foundation for the next great bull market gets built.
The fire sale is coming. Are you prepared to buy?
Disclaimer: This analysis is for educational purposes only and should not be considered financial advice. Past performance does not guarantee future results. Always conduct your own research and consult with financial professionals before making investment decisions.
Note
Weighted Probability Re‑Assessment:Taking into account the historical pattern where gold often suffers sharp corrections when interest rates
🔵 Base case (60%) - A shallow 10–15% pullback to $3,200–3,400 over 3–6 months. Any weakness is likely to be aggressively bought by sovereigns, creating a V‑shaped recovery rather than a prolonged bear market.
🔴 Bear case (20%) - A deeper 20–25% flush in a 2008‑style liquidity shock, driven by forced ETF liquidation and margin calls. This remains a tail risk, not the central projection.
🟢 Bull case (20%) - Shallow consolidation before new highs if real yields (currently ~1.5–1.7%) compress faster or turn negative sooner than expected, amplifying the secular bull trend.

Related publications
Disclaimer
The information and publications are not meant to be, and do not constitute, financial, investment, trading, or other types of advice or recommendations supplied or endorsed by TradingView. Read more in the Terms of Use.
Related publications
Disclaimer
The information and publications are not meant to be, and do not constitute, financial, investment, trading, or other types of advice or recommendations supplied or endorsed by TradingView. Read more in the Terms of Use.