For all the headlines about inflation risk, interest rate uncertainty, and geopolitical instability, the S&P 500 hasn’t flinched much lately. Price ranges have narrowed, option premiums have deflated since April, and market volatility metrics remain stuck near cycle lows.

However, short-dated MES weekly options expiring 24/October — typically more responsive to shifts in implied volatility (IV) — showed an upward shift in the IV smile early in the month, pointing to renewed demand for downside protection.

Source: CME QuikVol
Historical volatility remains below implied levels, leaving scope for realised volatility to rise to implied levels. Current options positioning suggests that the next volatility move is likely to emerge from downside risk.

Source: CME QuikVol
The Cboe Volatility Index (VIX), reflecting 30-day expected volatility in the S&P 500, drifted toward 15 and stayed compressed for over a month. While this appeared stable, volatility is inherently mean-reverting — especially amid macro uncertainty, geopolitical risks, and year-end positioning.

Economic data have not justified a hawkish Fed stance, and markets expect another rate cut at the 29 October meeting. Additional uncertainty stems from the government shutdown, which delayed the September CPI release and left investors without timely inflation guidance. This has amplified market sensitivity to new data and headlines.
Meanwhile, Fed officials have turned more dovish, shifting attention from inflation to signs of labour market weakness.

Source: CME FedWatch
So far, the uncertainty has not prompted a broad flight to safety. Although the VIX has risen almost 60% this month, the S&P 500’s decline was just 1.2% as of 17 October. Markets appear hesitant to reprice risk aggressively without confirmation from data or the Fed — a shift that could accelerate near the 24/October CPI release.
When Volatility Snaps Back
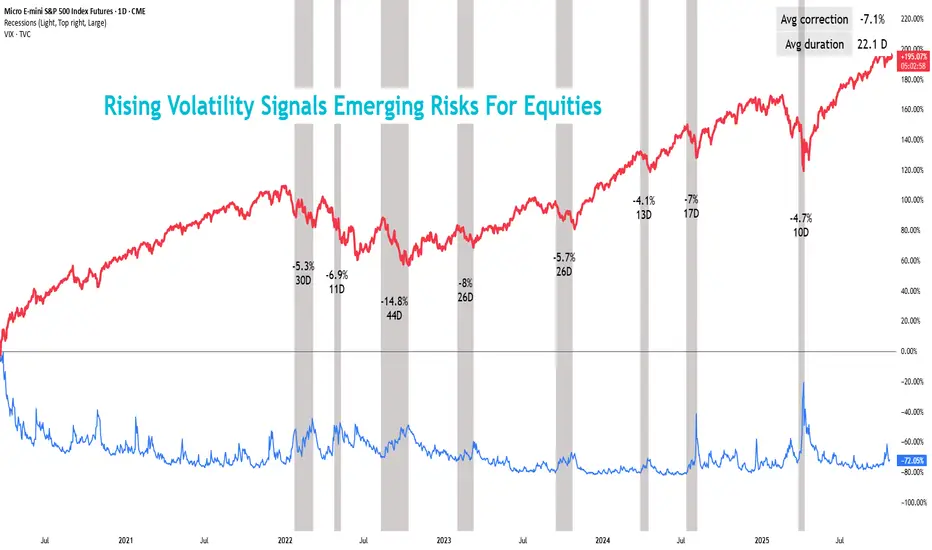
Historically, volatility spikes have also driven sharp corrections in equity futures. Since 2022, the average duration of a VIX rise regime is about 22 days, with a 7% average correction in equity futures during that period.

This trend offers multiple opportunities for traders. With a week left for key macro data to come out and almost two weeks left for the next Fed meeting, a short-term position to gain from volatility expansion could be expressed by deploying a straddle using CME’s E-mini S&P 500 (ES) weekly options.
However, with VIX already elevated and reaching 28 late last week, further upside from long volatility trades appears limited. In contrast, a short equity futures position could still benefit from additional downside as uncertainty pressures equities.
As of this analysis, VIX had been rising for 7 days, implying that IV could stay elevated for roughly another 15 days based on historical regime durations. Notably, the larger portion of S&P futures’ correction typically occurs during the latter half of this rising volatility phase.

The average correction over the latter 15-days is almost 7x more than that observed in the first week of rising IV. And given the 1.3% decline so far in this cycle, there is still room for realised volatility to catch up via an additional 2.7% correction.
As on 17/Oct, MES options expiring on 31/Oct serves to capture the remaining 15-day window. Concentrated activity across key strikes in this contract indicates that options traders are pricing in a potential decline of roughly 3% to 7.7% in equity futures.

Source: CME QuikStrike
In an expanding volatility regime, short S&P 500 futures offer an alternative way to express views on rising volatility. Straddles suit uncertain bias but require larger moves to overcome time decay. With expectations of further downside and higher realised volatility, short futures may be better aligned.
Historical Example
The inverse correlation between VIX and equity index futures supports a directional bias tied to IV expectations. Historical VIX spikes show extended periods of elevated IV, typically aligning with a 7% average drawdown in equity futures.
A strategy that trades in line with the prevailing volatility trend can exploit this pattern. Assuming IV remains elevated, equity futures generally experience their steepest declines during the later part of rising VIX regime. Across the last eight major IV spikes, this relationship has held consistently.
The following historical analysis examines a strategy that moves with the prevailing volatility trend. The approach assumes that implied volatility (IV) will remain elevated for an extended period, during which equity futures tend to decline more sharply. As shown in prior instances, this pattern held true across the last eight major IV spikes.
A short MES futures position initiated seven days after a VIX spike has historically produced strong returns.

For example, during the July 2024 volatility surge (highlighted in green above), entering short at 5600 on 18 July (7 days after VIX started to rise) and exiting 15 days later at 5247 on 5 August would have yielded a profit of (5600 – 5247) × $5 = $1,765.
However, the strategy is not consistently profitable. During the September 2023 episode (highlighted in yellow above), a similar short position entered at 4368 on 21/September and exited 15 days later at the same level would have produced no gain, underscoring that historical tendencies serve as context, not certainty.
Alternatively, if volatility stabilises and uncertainty eases, short positions could also underperform as equities resume their ascent.
This content is sponsored.
MARKET DATA
CME Real-time Market Data helps identify trading set-ups and express market views better. If you have futures in your trading portfolio, you can check out on CME Group data plans available that suit your trading needs tradingview.com/cme.
DISCLAIMER
This case study is for educational purposes only and does not constitute investment recommendations or advice. Nor are they used to promote any specific products, or services.
Trading or investment ideas cited here are for illustration only, as an integral part of a case study to demonstrate the fundamental concepts in risk management or trading under the market scenarios being discussed. Please read the FULL DISCLAIMER the link to which is provided in our profile description.
However, short-dated MES weekly options expiring 24/October — typically more responsive to shifts in implied volatility (IV) — showed an upward shift in the IV smile early in the month, pointing to renewed demand for downside protection.
Source: CME QuikVol
Historical volatility remains below implied levels, leaving scope for realised volatility to rise to implied levels. Current options positioning suggests that the next volatility move is likely to emerge from downside risk.
Source: CME QuikVol
The Cboe Volatility Index (VIX), reflecting 30-day expected volatility in the S&P 500, drifted toward 15 and stayed compressed for over a month. While this appeared stable, volatility is inherently mean-reverting — especially amid macro uncertainty, geopolitical risks, and year-end positioning.
Economic data have not justified a hawkish Fed stance, and markets expect another rate cut at the 29 October meeting. Additional uncertainty stems from the government shutdown, which delayed the September CPI release and left investors without timely inflation guidance. This has amplified market sensitivity to new data and headlines.
Meanwhile, Fed officials have turned more dovish, shifting attention from inflation to signs of labour market weakness.
Source: CME FedWatch
So far, the uncertainty has not prompted a broad flight to safety. Although the VIX has risen almost 60% this month, the S&P 500’s decline was just 1.2% as of 17 October. Markets appear hesitant to reprice risk aggressively without confirmation from data or the Fed — a shift that could accelerate near the 24/October CPI release.
When Volatility Snaps Back
Historically, volatility spikes have also driven sharp corrections in equity futures. Since 2022, the average duration of a VIX rise regime is about 22 days, with a 7% average correction in equity futures during that period.
This trend offers multiple opportunities for traders. With a week left for key macro data to come out and almost two weeks left for the next Fed meeting, a short-term position to gain from volatility expansion could be expressed by deploying a straddle using CME’s E-mini S&P 500 (ES) weekly options.
However, with VIX already elevated and reaching 28 late last week, further upside from long volatility trades appears limited. In contrast, a short equity futures position could still benefit from additional downside as uncertainty pressures equities.
As of this analysis, VIX had been rising for 7 days, implying that IV could stay elevated for roughly another 15 days based on historical regime durations. Notably, the larger portion of S&P futures’ correction typically occurs during the latter half of this rising volatility phase.
The average correction over the latter 15-days is almost 7x more than that observed in the first week of rising IV. And given the 1.3% decline so far in this cycle, there is still room for realised volatility to catch up via an additional 2.7% correction.
As on 17/Oct, MES options expiring on 31/Oct serves to capture the remaining 15-day window. Concentrated activity across key strikes in this contract indicates that options traders are pricing in a potential decline of roughly 3% to 7.7% in equity futures.
Source: CME QuikStrike
In an expanding volatility regime, short S&P 500 futures offer an alternative way to express views on rising volatility. Straddles suit uncertain bias but require larger moves to overcome time decay. With expectations of further downside and higher realised volatility, short futures may be better aligned.
Historical Example
The inverse correlation between VIX and equity index futures supports a directional bias tied to IV expectations. Historical VIX spikes show extended periods of elevated IV, typically aligning with a 7% average drawdown in equity futures.
A strategy that trades in line with the prevailing volatility trend can exploit this pattern. Assuming IV remains elevated, equity futures generally experience their steepest declines during the later part of rising VIX regime. Across the last eight major IV spikes, this relationship has held consistently.
The following historical analysis examines a strategy that moves with the prevailing volatility trend. The approach assumes that implied volatility (IV) will remain elevated for an extended period, during which equity futures tend to decline more sharply. As shown in prior instances, this pattern held true across the last eight major IV spikes.
A short MES futures position initiated seven days after a VIX spike has historically produced strong returns.
For example, during the July 2024 volatility surge (highlighted in green above), entering short at 5600 on 18 July (7 days after VIX started to rise) and exiting 15 days later at 5247 on 5 August would have yielded a profit of (5600 – 5247) × $5 = $1,765.
However, the strategy is not consistently profitable. During the September 2023 episode (highlighted in yellow above), a similar short position entered at 4368 on 21/September and exited 15 days later at the same level would have produced no gain, underscoring that historical tendencies serve as context, not certainty.
Alternatively, if volatility stabilises and uncertainty eases, short positions could also underperform as equities resume their ascent.
This content is sponsored.
MARKET DATA
CME Real-time Market Data helps identify trading set-ups and express market views better. If you have futures in your trading portfolio, you can check out on CME Group data plans available that suit your trading needs tradingview.com/cme.
DISCLAIMER
This case study is for educational purposes only and does not constitute investment recommendations or advice. Nor are they used to promote any specific products, or services.
Trading or investment ideas cited here are for illustration only, as an integral part of a case study to demonstrate the fundamental concepts in risk management or trading under the market scenarios being discussed. Please read the FULL DISCLAIMER the link to which is provided in our profile description.
Full Disclaimer - linktr.ee/mintfinance
Related publications
Disclaimer
The information and publications are not meant to be, and do not constitute, financial, investment, trading, or other types of advice or recommendations supplied or endorsed by TradingView. Read more in the Terms of Use.
Full Disclaimer - linktr.ee/mintfinance
Related publications
Disclaimer
The information and publications are not meant to be, and do not constitute, financial, investment, trading, or other types of advice or recommendations supplied or endorsed by TradingView. Read more in the Terms of Use.