Trading Plan for 19-Nov-2024
Intro: Previous Day’s Chart Analysis
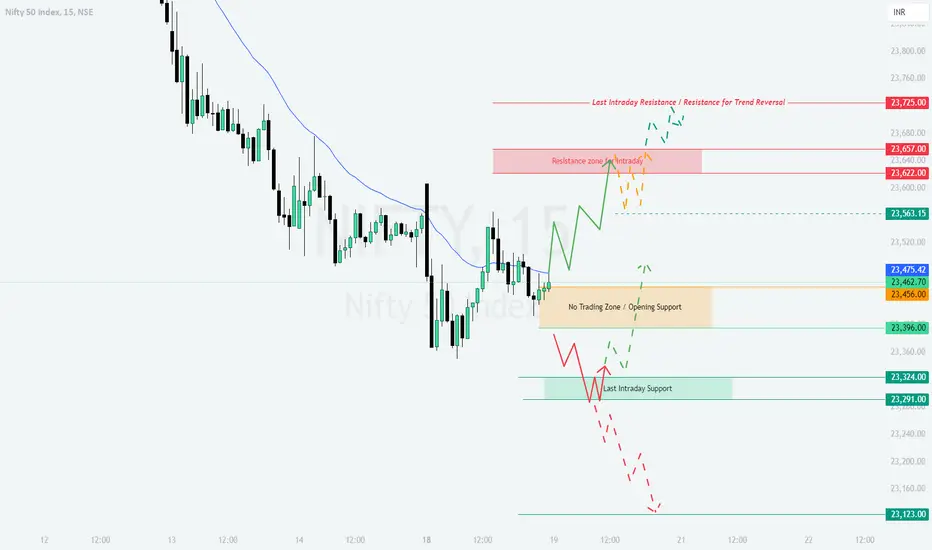
On 18-Nov-2024, the market exhibited a mix of bullish recovery and consolidation. Yellow regions indicated sideways movement, suggesting indecision in the market. Green zones demonstrated bullish recovery attempts, while Red zones highlighted bearish breakdown scenarios. Intraday resistance at 23,725 played a key role in limiting gains, while support at 23,324 helped prevent a deeper sell-off.
Gap-Up Opening Scenario (+100 Points or More):
Intro: Previous Day’s Chart Analysis
On 18-Nov-2024, the market exhibited a mix of bullish recovery and consolidation. Yellow regions indicated sideways movement, suggesting indecision in the market. Green zones demonstrated bullish recovery attempts, while Red zones highlighted bearish breakdown scenarios. Intraday resistance at 23,725 played a key role in limiting gains, while support at 23,324 helped prevent a deeper sell-off.
Gap-Up Opening Scenario (+100 Points or More):
- [] If Nifty opens around 23,600–23,700, look for rejection near the resistance zone at 23,657. Wait for a confirmation candle before entering short positions, targeting the 23,456 support.
[] If momentum sustains above 23,657, expect bullish continuation towards 23,725. Initiate longs after a retest of 23,657, with a stop loss at 23,600. - Avoid initiating trades if Nifty stays within 23,657–23,725 without a clear breakout or breakdown.
Flat Opening Scenario (+/- 50 Points):- [] A flat open near 23,462–23,475 would place the market in the No Trading Zone. Observe price action in this zone to gauge direction.
[] If the index breaks below 23,456, short with targets at 23,396 and 23,324, maintaining a stop loss at 23,475. - For bullish setups, a breakout above 23,475 could lead to a move toward 23,657, with stop losses placed at 23,450.
Gap-Down Opening Scenario (-100 Points or More):- [] If Nifty opens near 23,324–23,350, monitor for a pullback to 23,396. Short positions can be initiated on rejection at 23,396, targeting 23,291 and 23,123.
[] A strong recovery above 23,396 could indicate bullish reversal potential. Longs can be considered after confirmation, with targets at 23,475. - For aggressive selling, watch for a breach below 23,291, which may trigger further downside to 23,123. Use tight stop losses to manage risk.
Risk Management Tips for Options Trading:- [] Avoid chasing trades immediately after the opening bell; let the first 15–30 minutes establish a clear trend.
[] Use stop losses based on hourly candle closes to reduce the impact of market noise.
[] Limit position sizes in volatile zones and avoid holding positions into key economic events.
[] Keep track of implied volatility (IV) levels to assess premium pricing; avoid overpaying for options.
Summary and Conclusion:
The market's reaction near critical levels such as 23,657 (resistance) and 23,324 (support) will determine the trend for the day. Bullish momentum above 23,657 could target 23,725, while failure to hold 23,324 may lead to a retest of 23,123. Follow disciplined trading, and remember that patience and risk management are key to navigating uncertain conditions.
Disclaimer: I am not a SEBI-registered analyst. All information provided is for educational purposes only. Traders are advised to conduct their own research or consult a financial advisor before making any investment decisions.
- [] Avoid chasing trades immediately after the opening bell; let the first 15–30 minutes establish a clear trend.
- [] If Nifty opens near 23,324–23,350, monitor for a pullback to 23,396. Short positions can be initiated on rejection at 23,396, targeting 23,291 and 23,123.
- [] A flat open near 23,462–23,475 would place the market in the No Trading Zone. Observe price action in this zone to gauge direction.
Disclaimer
The information and publications are not meant to be, and do not constitute, financial, investment, trading, or other types of advice or recommendations supplied or endorsed by TradingView. Read more in the Terms of Use.
Disclaimer
The information and publications are not meant to be, and do not constitute, financial, investment, trading, or other types of advice or recommendations supplied or endorsed by TradingView. Read more in the Terms of Use.