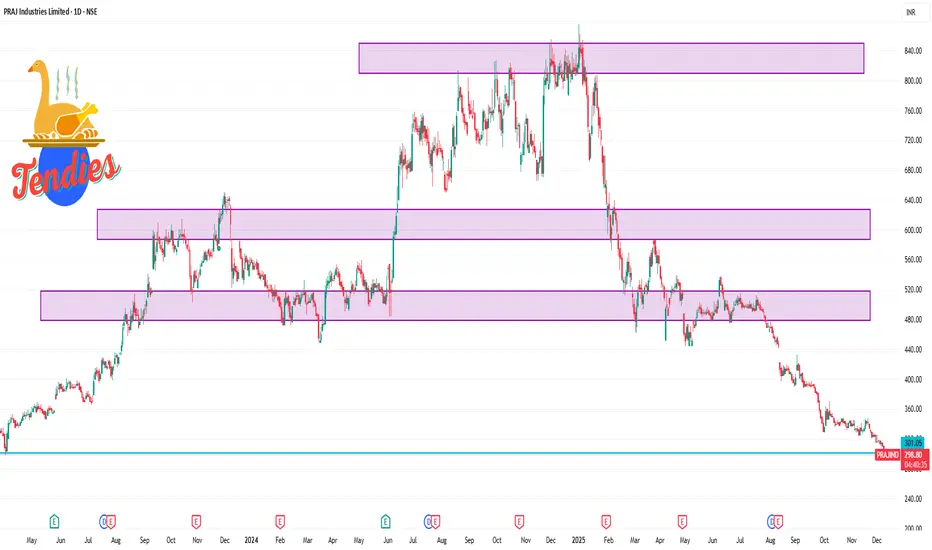
📌 Current Live Price & Trend
✅ PRAJIND is trading around ₹300–₹302 on the NSE today (down ~2–3%).
✅ The stock recently hit a new 52-week low, showing a strong bearish trend and weakness.
Market Context (Short-Term Trend):
Price is trading below key moving averages (5D, 20D, 50D, etc.).
This suggests bearish pressure on the 1-day and short-term charts.
📊 1-Day Intraday Levels (Approximate)
🟥 Resistance (Upside Barriers):
R1: ~₹308 – initial resistance near short-term bounce area
R2: ~₹315 – psychological resistance zone
R3: ~₹322 – higher resistance from recent intra-week levels
🟩 Support (Downside Levels):
S1: ~₹297 – immediate intraday support
S2: ~₹290 – lower support from recent swing lows
S3: ~₹280 – significant downside support zone
Related publications
Disclaimer
The information and publications are not meant to be, and do not constitute, financial, investment, trading, or other types of advice or recommendations supplied or endorsed by TradingView. Read more in the Terms of Use.
Related publications
Disclaimer
The information and publications are not meant to be, and do not constitute, financial, investment, trading, or other types of advice or recommendations supplied or endorsed by TradingView. Read more in the Terms of Use.