🔍Technical Analysis
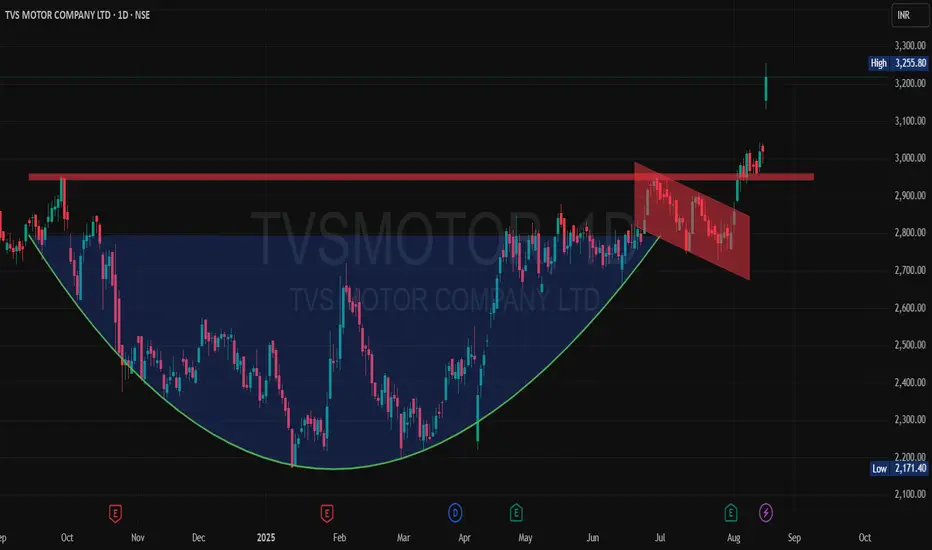
TVS Motor has delivered an extraordinary multi-decade performance journey. From trading around ₹250 during COVID-2020, the stock staged a phenomenal super bullish rally reaching ₹2,958 by September 2024 - its previous all-time high that acted as strong resistance.
Post this peak, the stock corrected to ₹2,200 levels before making another attempt at the resistance zone. The crucial breakout moment came with strong Q1 FY26 results showing significant YoY net profit growth, propelling the stock above ₹2,958 resistance and currently trading at ₹3,020.
Entry Strategy: Only enter on confirmed breakout sustainability above ₹2,958 (previous resistance now support).
Targets 🎯:
🎯Target 1: ₹3,100
🎯Target 2: ₹3,200
🎯Target 3: ₹3,300
Stop Losses:
Minor Stop: ₹2,958 (previous resistance, now key support)
Major Stop: ₹2,700-₹2,800 (strong demand zone)
Breach of ₹2,700 zone would completely invalidate the bullish thesis and signal no further expectations.
💰Q1 FY26 Financial Highlights (vs Q4 FY25 & Q1 FY25)
- Total Income: ₹12,210 Cr (↑ +6% QoQ from ₹11,542 Cr; ↑ +18% YoY from ₹10,314 Cr)
- Total Expenses: ₹10,407 Cr (↑ +8% QoQ from ₹9,638 Cr; ↑ +17% YoY from ₹8,884 Cr)
- Operating Profit: ₹1,803 Cr (↓ -5% QoQ from ₹1,904 Cr; ↑ +26% YoY from ₹1,431 Cr)
- Profit Before Tax: ₹977 Cr (↓ -3% QoQ from ₹1,004 Cr; ↑ +32% YoY from ₹738 Cr)
- Profit After Tax: ₹643 Cr (↓ -8% QoQ from ₹698 Cr; ↑ +33% YoY from ₹485 Cr)
- Diluted EPS: ₹12.84 (↓ -6% QoQ from ₹13.64; ↑ +32% YoY from ₹9.70)
🧠Fundamental Highlights
TVS Motor crossed the historic ₹10,000 crore revenue milestone in Q1 FY26 with 20% YoY growth, achieving highest-ever EBITDA, PBT, and sales volumes. Consolidated net profit surged 35% YoY to ₹643 crore despite sequential dip from Q4.
Company benefited from strong exports surge, EV sales growth of 35%, premium bikes performance, and finance segment expansion. Strategic initiative to reduce China dependence while expanding global footprint positions TVS favorably for sustainable growth.
Market cap stands at ₹1,43,491 crore (up 16.2% in 1 year) with promoter holding stable at 50.3%. Current trading levels around ₹3,018 with recent high of ₹3,049.7 confirm the technical breakout above historical resistance.
The electric scooter segment showing 35% volume growth demonstrates company's successful transition strategy. Finance business and premium motorcycle segments providing additional revenue diversification.
✅Conclusion
TVS Motor's breakout above ₹2,958 all-time high resistance, backed by record Q1 revenue crossing ₹10,000 crore and 33% YoY PAT growth, signals the start of a fresh multi-year rally. The 2+ decade resistance break with strong fundamental support makes this a compelling long-term investment opportunity targeting ₹3,300+ levels. Key is sustaining above ₹2,958 support zone.
Disclaimer: lnkd.in/gJJDnvn2
Disclaimer
The information and publications are not meant to be, and do not constitute, financial, investment, trading, or other types of advice or recommendations supplied or endorsed by TradingView. Read more in the Terms of Use.
Disclaimer
The information and publications are not meant to be, and do not constitute, financial, investment, trading, or other types of advice or recommendations supplied or endorsed by TradingView. Read more in the Terms of Use.