🔍 XAU/USD Technical Analysis: Major Levels, Market Structure, and Trade Ideas
In this detailed analysis of XAU/USD, we highlight key supply and demand zones, dynamic trendlines, and the interplay of structural shifts to help traders navigate the current price action effectively.
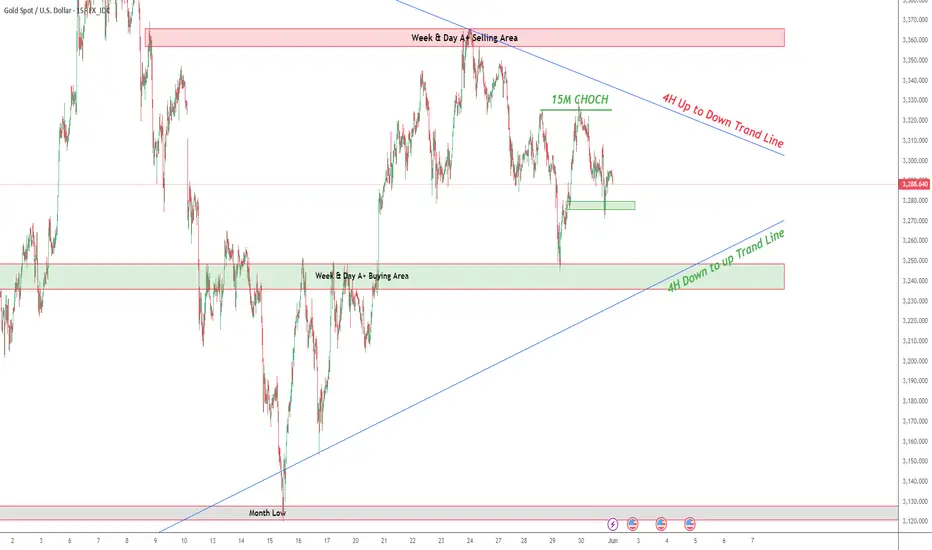
🔴 Key Supply Zone (Week & Day A+ Selling Area)
Location: Above 3,320- 3,330
Significance: This red zone has historically acted as a strong resistance area. Price has failed multiple times to break above it convincingly, suggesting institutional selling pressure.
Implication: Any revisit to this zone could trigger bearish rejection, making it a key level for short setups.
🟢 Major Demand Zone (Week & Day A+ Buying Area)
Location: 3,230–3,260 region
Significance: This green zone has consistently provided support for price, as shown by multiple bounces from it. It suggests strong buying interest from institutions or large market participants.
Implication: Traders can watch for bullish price action in this area to confirm potential long opportunities.
📈 Dynamic Trendlines
🔵 4H Down-to-Up Trend Line:
This ascending trendline, drawn from major swing lows, suggests that the broader 4H market structure remains bullish.
Use: Acts as dynamic support for possible bounces.
🔴 4H Up-to-Down Trend Line:
This descending trendline captures the bearish structure in the 4H timeframe, connecting the lower highs and indicating ongoing selling pressure.
Use: Functions as a dynamic resistance area.
✅ 15M Change of Character (CHoCH)
This micro timeframe level marks a shift in sentiment from bearish to bullish, providing early confirmation for potential reversals or continuation plays.
Use: Intraday traders can utilize this for short-term entries in line with the broader bias.
🔻 Monthly Low Level
Location: Around 3,120
Significance: This level marks the lowest point in the recent monthly cycle and serves as a crucial support area for the broader trend.
Implication: A break below this level would suggest further downside potential.
💡 Trade Scenarios
1️⃣ Bullish Scenario
If price retests the Week & Day A+ Buying Area (3,240–3,260) and forms bullish confirmation (like a bullish engulfing candle or 15M CHoCH shift), a long trade could be initiated.
Potential Targets:
4H descending trendline near 3,300
Week & Day A+ Selling Area above 3,320
2️⃣ Bearish Scenario
If price reaches the 4H descending trendline or the selling zone above 3,320 and forms bearish rejection, shorts can be considered.
A break below the 4H ascending trendline and the demand zone would open the door for deeper downside, with the ultimate target at the Month Low near 3,120.
📝 Conclusion
XAU/USD is consolidating within a crucial range, balancing supply and demand forces. The dual-trendline structure signals a potential breakout in the coming sessions. Short-term traders can leverage the 15M CHoCH for early entries, while swing traders should focus on the interplay between the higher timeframe zones and trendlines.
📌 Reminder: Always wait for confirmation before entering trades and manage risk according to your trading plan.
🔔 Follow for updates! Let me know if you have any questions or want to discuss your own analysis. Happy trading! 🚀✨
In this detailed analysis of XAU/USD, we highlight key supply and demand zones, dynamic trendlines, and the interplay of structural shifts to help traders navigate the current price action effectively.
🔴 Key Supply Zone (Week & Day A+ Selling Area)
Location: Above 3,320- 3,330
Significance: This red zone has historically acted as a strong resistance area. Price has failed multiple times to break above it convincingly, suggesting institutional selling pressure.
Implication: Any revisit to this zone could trigger bearish rejection, making it a key level for short setups.
🟢 Major Demand Zone (Week & Day A+ Buying Area)
Location: 3,230–3,260 region
Significance: This green zone has consistently provided support for price, as shown by multiple bounces from it. It suggests strong buying interest from institutions or large market participants.
Implication: Traders can watch for bullish price action in this area to confirm potential long opportunities.
📈 Dynamic Trendlines
🔵 4H Down-to-Up Trend Line:
This ascending trendline, drawn from major swing lows, suggests that the broader 4H market structure remains bullish.
Use: Acts as dynamic support for possible bounces.
🔴 4H Up-to-Down Trend Line:
This descending trendline captures the bearish structure in the 4H timeframe, connecting the lower highs and indicating ongoing selling pressure.
Use: Functions as a dynamic resistance area.
✅ 15M Change of Character (CHoCH)
This micro timeframe level marks a shift in sentiment from bearish to bullish, providing early confirmation for potential reversals or continuation plays.
Use: Intraday traders can utilize this for short-term entries in line with the broader bias.
🔻 Monthly Low Level
Location: Around 3,120
Significance: This level marks the lowest point in the recent monthly cycle and serves as a crucial support area for the broader trend.
Implication: A break below this level would suggest further downside potential.
💡 Trade Scenarios
1️⃣ Bullish Scenario
If price retests the Week & Day A+ Buying Area (3,240–3,260) and forms bullish confirmation (like a bullish engulfing candle or 15M CHoCH shift), a long trade could be initiated.
Potential Targets:
4H descending trendline near 3,300
Week & Day A+ Selling Area above 3,320
2️⃣ Bearish Scenario
If price reaches the 4H descending trendline or the selling zone above 3,320 and forms bearish rejection, shorts can be considered.
A break below the 4H ascending trendline and the demand zone would open the door for deeper downside, with the ultimate target at the Month Low near 3,120.
📝 Conclusion
XAU/USD is consolidating within a crucial range, balancing supply and demand forces. The dual-trendline structure signals a potential breakout in the coming sessions. Short-term traders can leverage the 15M CHoCH for early entries, while swing traders should focus on the interplay between the higher timeframe zones and trendlines.
📌 Reminder: Always wait for confirmation before entering trades and manage risk according to your trading plan.
🔔 Follow for updates! Let me know if you have any questions or want to discuss your own analysis. Happy trading! 🚀✨
"Join my daily live streams from 10:30 AM to 8:30 PM on TradeX Algo Live for live analysis of Forex and crypto. Subscribe to my YouTube channel at youtube.com/@TradeXAlgoLive
Disclaimer
The information and publications are not meant to be, and do not constitute, financial, investment, trading, or other types of advice or recommendations supplied or endorsed by TradingView. Read more in the Terms of Use.