ChennaiPetro: Wedge & Trendline BO with 61.8%, Chart of the WeekNSE:CHENNPETRO Explosive Breakout: Why This Refinery Stock Could Rally Another 30% After Its Q2 Turnaround. This PSU Refinery Stock Broke Through ₹979 Levels - Here's What Traders Need to Know About the Next Move. Let's Analyse in our Chart of the Week Below.
As per the Latest SEBI Mandate, this isn't a Trading/Investment RECOMMENDATION nor for Educational Purposes; it is just for Informational purposes only. The chart data used is 3 Months old, as Showing Live Chart Data is not allowed according to the New SEBI Mandate.
Disclaimer: "I am not a SEBI REGISTERED RESEARCH ANALYST AND INVESTMENT ADVISER."
This analysis is intended solely for informational purposes and should not be interpreted as financial advice. It is advisable to consult a qualified financial advisor or conduct thorough research before making investment decisions.
Price Action Analysis:
Trend Structure and Momentum:
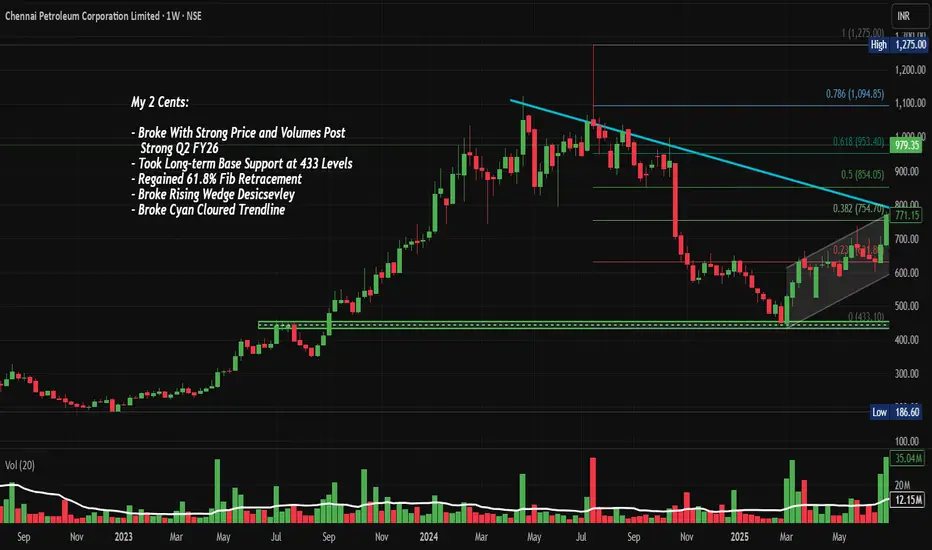
- The stock experienced a prolonged uptrend from March 2023 to July 2024, rallying from base levels around ₹433 to a peak of ₹1,275, representing approximately 195% appreciation
- Post the July 2024 peak, the stock entered a corrective phase characterised by lower highs and consolidation
- Recent price action shows a breakout above the descending cyan trendline that had been capping rallies since mid-2024
- Current price of ₹979.35 (as of October 31, 2025) represents a 26.80% gain, indicating strong buying momentum
- The stock is trading above all key Fibonacci retracement levels, having reclaimed the 61.8% level at approximately ₹953
Candlestick Patterns and Formations:
- The most recent candle shows a strong bullish close with a substantial body, indicating conviction in the upward move
- The chart displays a rising wedge/descending channel pattern that was broken decisively in recent sessions
- Prior consolidation between ₹700-₹850 formed a re-accumulation base, which has now been breached to the upside
- The breakout candle demonstrates strong price and volume expansion, a classic sign of institutional participation
Volume Spread Analysis:
Volume Characteristics:
- Recent volume surge to 90.39 million shares significantly exceeds the average volume of 13.46 million, representing approximately 6.7x normal trading activity
- The volume spike coincides with the price breakout, validating the move as genuine rather than a false breakout
- Historical volume analysis shows similar spikes during major trend reversals, particularly during the March 2023 base breakout
- Volume expansion without corresponding price weakness suggests strong demand absorption at current levels
Volume-Price Relationship:
- The volume profile indicates heavy accumulation in the ₹700-₹800 zone, which now serves as a critical support cluster
- Recent sessions show sustained above-average volume, suggesting institutional interest rather than retail speculation
- The volume pattern aligns with a classic "breakout with expansion" scenario, increasing the probability of trend continuation
Support and Resistance Levels:
Key Support Zones:
- Primary Support (S1): ₹854 - This represents the 0.5 Fibonacci retracement level and previous consolidation high
- Secondary Support (S2): ₹754 - The 0.382 Fibonacci level and recent breakout point from the descending trendline
- Critical Support (S3): ₹631 - The 0.236 Fibonacci level and long-term base support at ₹433-₹450 zone
- The grey trendline originating from the 2024 lows provides dynamic support, currently positioned around ₹720
Key Resistance Zones:
- Immediate Resistance (R1): ₹1,094 - The 0.786 Fibonacci retracement level
- Major Resistance (R2): ₹1,275 - The all-time high achieved in July 2024 and psychological resistance
- Extended Resistance (R3): ₹1,400-₹1,500 - Projected based on measured move from the consolidation range
Technical Patterns and Indicators:
Chart Patterns:
- Descending Channel Breakout: The stock has successfully breached the cyan-colored descending trendline that acted as resistance since July 2024
- Rising Wedge Resolution: The consolidation pattern between August and October 2025 has resolved to the upside
- Base-on-Base Formation: The ₹433 level established in early 2024 served as the foundation for the subsequent rally, demonstrating strong long-term base support
- Cup and Handle (Potential): If the stock consolidates between ₹950-₹1,050 and then breaks out, it could form a cup and handle pattern projecting toward ₹1,400+
Fibonacci Analysis:
- The 61.8% Fibonacci retracement at ₹953 has been convincingly reclaimed, suggesting the corrective phase may be complete
- Golden ratio support held perfectly during the September-October consolidation
- The next Fibonacci target at 0.786 (₹1,094) represents the immediate upside objective
- Fibonacci extension levels project Upmove at ₹1,350 (1.272 extension) and ₹1,500 (1.618 extension) if the rally extends
Risk Factors and Invalidation Levels:
- A close below ₹920 would signal a potential false breakout
- Sustained trading below ₹850 would invalidate the bullish setup and suggest resumption of the downtrend
- Weekly close below the broken trendline (currently around ₹940) would be a bearish reversal signal
- Failure to maintain above 61.8% Fibonacci retracement could trigger another corrective leg
Fundamental and Sectoral Backdrop:
Company Fundamentals:
- Chennai Petroleum Corporation (CPCL) reported Q2 FY26 revenue of ₹16,327 crore with profit after tax of ₹719 crore
- The company achieved a crude throughput of 3.013 million metric tonnes (MMT) with a Gross Refining Margin (GRM) of $9.04 per barrel in Q2 FY26
- However, Q1 FY26 saw challenges with a net loss of ₹40 crore compared to a profit of ₹357 crore in Q1 FY25, primarily due to inventory losses and lower GRM of $3.22 per barrel
- For H1 FY26, CPCL recorded net profit of ₹689.68 crore versus a net loss of ₹294.45 crore in H1 FY25, with average GRM at $6.17 per barrel
- The company achieved a record crude throughput of 11.642 MMT with 111% capacity utilisation
Business Operations and Product Portfolio:
- CPCL is engaged in refining crude oil to produce various petroleum products, including LPG, Motor Spirit, Kerosene, Aviation Turbine Fuel, High Speed Diesel, Naphtha, Fuel Oil, and Bitumen
- The company also produces speciality products like Paraffin Wax, Mineral Turpentine Oil, Hexane, and Petrochemical feedstocks
- Most fuel products are marketed by the parent company, Indian Oil Corporation (IOC), while CPCL directly markets speciality products
- In 2024, CPCL commissioned new infrastructure, including Pharma Grade Hexane production and Sustainable Aviation Fuel
Financial Metrics and Valuation:
- Market capitalisation stands at approximately ₹14,584 crore, with the company maintaining a healthy dividend payout of 35%
- CPCL has demonstrated strong return on equity with a 3-year ROE of 31% and has reduced debt levels
- Current price-to-earnings and other valuation metrics suggest the stock is reasonably valued considering sectoral challenges
Sector Outlook and Industry Trends:
- India's refining capacity increased to 258.1 MMTPA as of FY25, with domestic consumption at 239.2 MMTPA
- India is expected to drive global oil demand growth, with consumption projected at 5.74 million barrels per day in 2025 and 5.99 million bpd in 2026
- The country plans to expand refining capacity to 309.5 MMTPA by 2028
- Refinery output has been strong, with manufacturing IIP for refined petroleum products rising 4.24% in June 2025, driven by auto-fuel demand growth of 7.9% year-on-year
- However, refining margins are expected to fall below mid-cycle levels in FY25, indicating potential profitability challenges
Opportunities and Challenges:
Opportunities:
- Downstream activities driven by refinery-petrochemical integration are projected to post the highest 5.2% CAGR through 2030
- Growing domestic demand for petroleum products with urbanisation and economic growth
- Government initiatives supporting energy infrastructure development
- Indian refiners have benefited from processing discounted Russian crude, generating significant margins
Challenges:
- Net profit declined for the last two quarters, with an average decrease of 108.5% per quarter, and revenue fell 14.1% per quarter
- Volatile crude oil prices and fluctuating gross refining margins
- India's domestic crude oil production has fallen 26.3% and natural gas by 24.1% during FY12-FY25, leading to increased import dependency
- Environmental regulations and pressure to transition toward cleaner energy
- Institutional investment in CPCL decreased by 37.83% over the past 30 days
Competitive Position:
- CPCL is a subsidiary of Indian Oil Corporation, providing strategic advantages in product marketing and distribution
- The company competes with major refiners, including Reliance Industries, Bharat Petroleum, Hindustan Petroleum, and Mangalore Refinery
- CPCL's core vision is to be the most admired Indian energy company, creating value through world-class performance and ethical governance
- The company's location in South India provides strategic advantages for serving the region's growing energy needs
Fundamental Risks:
- The stock trades at reasonable valuations with potential upside to fair value estimates around ₹1,050
- Strong Q2 performance suggests earnings momentum is improving after a weak Q1
- Sectoral tailwinds from growing domestic demand support medium-term prospects
- Key risks include GRM volatility, crude price fluctuations, and regulatory changes
My 2 Cents:
- CPCL presents a compelling technical setup following the breakout from a multi-month consolidation pattern
- The combination of volume expansion, Fibonacci support, and trendline breach suggests potential for further upside
- Risk management is critical given sectoral volatility; strict adherence to stop losses is recommended
Full Coverage on my Newsletter this Week
Keep in the Watchlist and DOYR.
NO RECO. For Buy/Sell.
📌Thank you for exploring my idea! I hope you found it valuable.
🙏FOLLOW for more
👍BOOST if you found it useful.
✍️COMMENT below with your views.
Meanwhile, check out my other stock ideas on the right side until this trade is activated. I would love your feedback.
As per the Latest SEBI Mandate, this isn't a Trading/Investment RECOMMENDATION nor for Educational Purposes; it is just for Informational purposes only. The chart data used is 3 Months old, as Showing Live Chart Data is not allowed according to the New SEBI Mandate.
Disclaimer: "I am not a SEBI REGISTERED RESEARCH ANALYST AND INVESTMENT ADVISER."
This analysis is intended solely for informational purposes and should not be interpreted as financial advice. It is advisable to consult a qualified financial advisor or conduct thorough research before making investment decisions.
618 Fibonacci Retracement
VIPIND: Unlocking Potential After Downtrend
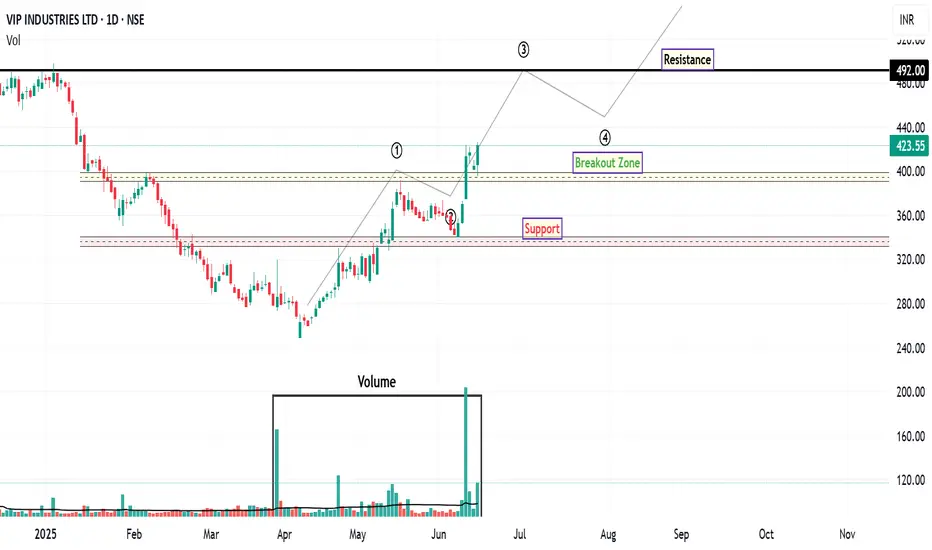
VIP Industries has demonstrated robust bullish momentum over the past few trading sessions, signaling a notable shift in market sentiment. This upward trajectory is particularly significant given the stock's prolonged downtrend since October 2024.
From an Elliott Wave perspective, the recent price action suggests the potential completion of a corrective phase. The retracement from what appears to be Wave 1 to Wave 2 aligns closely with the 61.8% Fibonacci retracement level, which often precedes the initiation of a strong Wave 3 impulse. This potential wave structure, if confirmed, could indicate further upside potential.
A key development supporting this bullish outlook is the stock's recent decisive close above its 200-day EMA, accompanied by a significant surge in trading volume. This confluence of price action and volume confirms strong buying interest and suggests a potential long-term trend reversal. The increased volume further validates the strength of the breakout, indicating broader market participation.
While the immediate outlook appears constructive, traders should be mindful of potential profit-taking around the ₹446 level. This area may present a temporary resistance zone where some short-term corrections or consolidation could occur. However, should the stock successfully navigate this level, the next significant upside resistance target to monitor is ₹492 . This level aligns with prior price highs and could represent a more substantial challenge for further upward movement.
For risk management purposes, a prudent approach would involve considering a stop-loss order positioned below the identified support zone, as depicted on the chart. This strategy aims to mitigate potential downside risk in the event of an unexpected reversal in market sentiment.
Disclaimer: The information provided in this technical analysis is for informational and educational purposes only and should not be construed as financial advice. It is based on observations from the provided chart and commonly used technical indicators. Market conditions can change rapidly, and past performance is not indicative of future results. Always conduct your own comprehensive due diligence and consult with a qualified financial advisor before making any investment decisions.
GSK Pharma - Chart of the MonthNSE:GLAXO has a beautiful structure on the Monthly Timeframe to Qualify for my Chart of the Month idea, it saw Heavy Volumes around the marked Key Levels which broke out and retested went to ATM and Again Retested and Bounced from that Place With Volumes in Last Month.
Also if we Use Fibonacci retracement it bounced from Crucial 0.618 Levels.
About:
NSE:GLAXO researches, manufactures and makes available a broad range of medicines and vaccines that benefit people, It's a Leading Global healthcare company part of GlaxoSmithKline plc (GSK), a British multinational pharmaceutical company headquartered in London.
Trade Setup:
Could be a good Positional Trade with those Key Levels as Major Support and AIM for New ATH.
📌Thank you for exploring my idea! I hope you found it valuable.
🙏FLLOW for more
👍BOOST if useful
✍️COMMENT Below your views.
Meanwhile, check out my other stock ideas on the right side until this trade is activated. I would love your feedback.
Disclaimer: "I am not SEBI REGISTERED RESEARCH ANALYST AND INVESTMENT ADVISER."
This analysis is intended solely for informational and educational purposes only and should not be interpreted as financial advice. It is advisable to consult a qualified financial advisor or conduct thorough research before making investment decisions.

61.8% Fib bullish reversal with Volumes on WeeklyNSE:HINDZINC The stock started a bullish reversal from its 0.618 Fibonacci retracement level. RSI is also supportive. A sustained move beyond 546 would lead to a strong up move shortly.
Above the 546 level trade will activate with a target of 680 and StopLoss 475
Check out my other stock ideas below until this trade gets activated, I would love your feedback.
Disclaimer: This analysis is intended solely for informational and educational purposes and should not be interpreted as financial advice. It is advisable to consult a qualified financial advisor or conduct thorough research before making investment decisions.

A Bullish Breakout Analysis of Alkyl AmineAlkyl Amine stock has recently exhibited a noteworthy price action following a consolidation phase that extended beyond 1,000 days. The stock has successfully retested a pivotal support level and demonstrated a robust bounce, closing above this key level, accompanied by a significant surge in buying volume. This development is indicative of a potential shift in the trend towards a bullish posture.
From an Elliott Wave analysis perspective, the stock appears to be in the early stages of a wave pattern. This observation aligns with the bounce occurring at the 61.8% Fibonacci retracement level from the most recent higher high, suggesting a critical change in momentum.
Further validating the bullish outlook, momentum indicators such as the RSI and the MACD are showing favourable signals on both the daily and weekly timeframes, reinforcing the likelihood of upward price movement.
In terms of potential price levels, the current-demand zone is identified between 2305 and 2349 . Should the stock succeed in closing above the initial resistance level at 2484 , the next resistance levels to monitor would be at 2848 , 3162 , and ultimately 3526 .
Disclaimer: This analysis is intended solely for informational and educational purposes and should not be interpreted as financial advice. It is advisable to consult a qualified financial advisor or conduct thorough research before making any investment decisions.

SBI Card SHORT - So Wave E high did not get taken out all this while even though, hence Setup still valid
- A 5 wave Fall (Wave i) on Hourly Charts can be Counted from Wave E high
- A 3 Wave Corrective Rise (Wave ii) in the form of an Expanded Flat retraced 0.618% of the Fall from Wave E high
- Price did Wave i and then ii, and now iii on Downside has Started📉
Wave i= Wave iii equality comes at ~ 845🎯
Trade Plan as follows:
Short at CMP= 915.5
Downside Target Zone= 850 - 840
Stop Loss= above 940

Nifty at 61.8% Fibonacci retracement levelNifty at 61.8% Fibonacci retracement level, it might get bearish here...

TATA Consumer looks strong…TATA Consumer looks strong…
Reasons/Traits :
• Today gave a break out from two day inside bars with a big green bar with very good volume
• Above 13 and 50 EMA
• Price touched 0.618 retracements levels
• RSI increasing
• Bearish Crab harmonic pattern formation is in place
What can happen next :
Scenario 1 : Price sustaining above 850/853 levels can take it to 865/870/915/940 levels
Scenario 2 : Price break down below 834 can take it down to 812/800/775/750 levels
Disclaimer : This analysis is only for educational purpose and not be considered as any trading idea/tip. Please consult your financial advisor before you take any trade and we are no way responsible for your profits/losses. Thank you!
Please do like and share this idea. Thanks

AMAR RAJA BATTERYi have mentioned everything on chart, you can also ask me in comments if you have any questions
Thanks

THOMAS COOK | POLE FLAG + SUPPORT CONFLUENCEREASONS FOR ENTERTING TRADE
1. A pole flag structure with the base of the flag bouncing off the 200EMA.
2.This 200EMA bounce point coincides with the long-term support trendline,
3. & the 61.8% retracement of the pole.
3. Price sustains above the flag range after retest
Buying above 65 for a projected price target which is set as the pole height, from the breakout point.
SL 56

Falling Wedge+ Three drives ~36k TargetSome TA
Follow and like for more
this is a falling wedge + three drives i am looking to long 36k i am already in a short from 52k
hope you have good evening

GESHIPPING Bouncing off at SupportGESHIPPING has formed flag structure at the support/resistance zone of 375 and has broken out of the flag. Also, this zone was previous resistance and has acted as decent support this time. 375 zone is also the 61.8 Fibonacci zone of the bigger range. The stock has found support at confluence of multiple technical indicators and has exhibited bullish candle with volume on Friday, 17 Sep. We are bullish on the stock and can expect it to touch previous highs of 440 and ATH of 480.

IFIND | Reasons for trade are given in the chart. Buy above 1100 (safe entries) for targets of 1242. SL 985.
Thank you.

Want 30% mover then watch this 10min video - Analysis made easy👑 Drop a follow here: @Averoy_Apoorv_Analysis 👑 ----------------------- 🔥🔥 Target: 2000 Followers 🔥🔥
👑 ITs a very good analysis video as I will try to trade this in realtime with you guys of course risk is diff for diff people but trading quality matters, not quantity :)
Good luck keep it in your watch now
⌛ Motivational and psychological area ⌛
✣Trade only if you are in the right mindset, if you have been emotionally weak for some time, take your time and don't trade, trade with a happy and + mindset only.
✣If you want to make money, firstly be prepared to lose it, only that much which you can afford and that much by which you can make a mistake again, learn from them and grow
✣Don't lose hope and keep grinding
✣I have seen my friends on youtube streaming games with watching 10, constantly they streamed for a year or two and now they are buzzing with 1k to 2k watching daily.
✣Focus on the process, you are here to make money not stupid decisions and lose it all
✣No one will help you climb the mountain, few will tell the path, so follow good people, make good mentors and make good decisions and choices in the stock market.
✣Believe in yourself :)
🎓🎓 Some info about me :)
➼My name is Apoorv and I am a 2nd year Engineering student, I want to pursue trading as my career, and thus whatsoever setups or trades I potentially see on my charting platform, I post it here and share them with you all.
➼I hope you will love my simple analysis style.
➼Feel free to suggest your view on this as learning is earning here :)
➼I take my trades on my Zerodha account :)
➼I don't take all the trades I post
➼These charts are my and only my work, my thought process, just from an educational point of view and no calls.
☃☃☃☃ Thank You Have a Nice Trading Day ☃☃☃☃

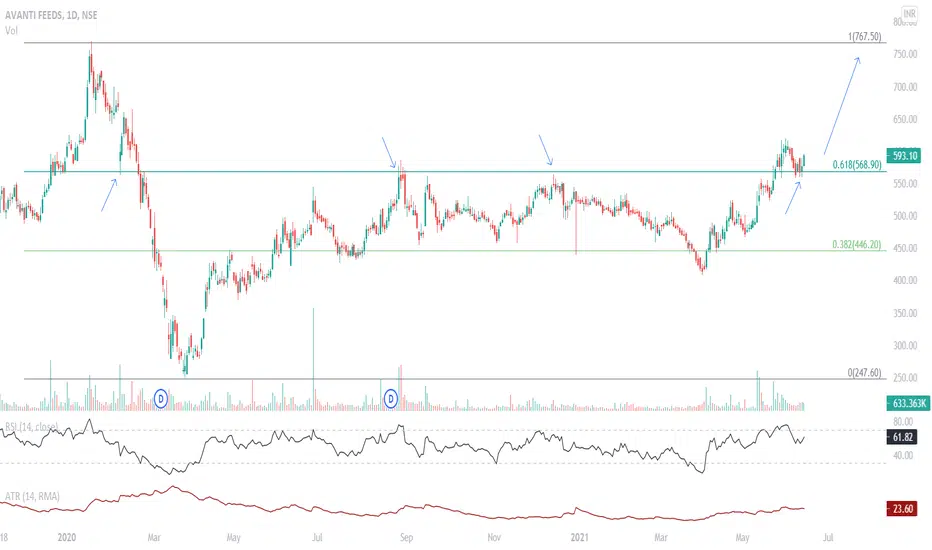
AVANTIFEED Reversing from Long Term 61.8 Retracement AVANTIFEED seems to be reversing from its long term 61.8 retracement zone. The stock has been hovering in the 38.2 and 61.8 zone for almost a year. Looks like a good buy here for eventual target of 750.
Johnsons Hitachi (JCHAC) at Year-Long SupportJohnsons Hitachi (JCHAC) stock is hovering at its year-long support where it has struck multiple times in the past. We are also at the 0.618 retracement from Aug'19 low to Mar'20 peak zone. We are closely monitoring the price action at this level. Any signs of bullishness would be a good time to go Long for a sharp up move. Will post an update on this post as we see something happening in the price of the stock.

ITC Channel and 0.618 Fibonacci LevelsITC previously corrected 0.618 fibonacci level after making swing high from march 2020 lows.
When channel drawn on swing high and March low 0.618 fibonacci level comes at lower end of channel. Coincidence or probability of downside in future.

AUD/CHF Technical analysisThe support of 0.68840 proves to be a tough nut for the bears.
After bouncing back sharply twice, the pair was under the cloud of a bearish trendline for 5 months, which has broken now.
Also, the pair found support at 61.8% of the previous rally, which is a strong bullish sign.
Hence, we expect the trade with bullish bias. The next levels to watch out for are the resistances of 0.72672 and the critical level of 0.73672, which is the 27.2% Fibonacci extension.
The crossing of both these levels can confirm a long-term uptrend in the counter.
